The Cost of War
Quantifying Human Idiocy - A precise accounting of what humans spend to destroy themselves, with numbers that would make a statistician weep.
Abstract
By redirecting 1% of global military spending to hyper-efficient pragmatic clinical trials, humanity can achieve 514 years of medical research in 20 years and shift the cure of every disease forward by 8.2 years, saving 416 million lives and generating $1.2 quadrillion in value.
Keywords
war-on-disease, 1-percent-treaty, medical-research, public-health, peace-dividend, decentralized-trials, dfda, dih, victory-bonds, health-economics, cost-benefit-analysis, clinical-trials, drug-development, regulatory-reform, military-spending, peace-economics, decentralized-governance, wishocracy, blockchain-governance, impact-investing
In 2024, humanity spent $2.72T on war. That’s not a typo. It’s the budget for your species’ most expensive and enduring hobby: organized violence. If you stacked that money in one-dollar bills, you could build a bridge two-thirds of the way to the Moon.
You are a species that spends enough on weapons to literally pave a road to space, yet you can’t figure out how to stop dying from preventable diseases.
This chapter is an audit of your collective insanity. It’s the itemized receipt for your self-destruction. Think of it as a credit card statement, except instead of Starbucks and Amazon, it’s missiles and murder robots, and instead of 23% APR, the interest is paid in human lives.
The Itemized Receipt for Armageddon
The immediate costs of war are like a grocery receipt from Hell. Everything is itemized. Everything has a price.
The Shopping List (2024 Global Data)
| Cost Category | Amount (USD Billions) | Per Capita | Daily Cost | Mathematical Basis |
|---|---|---|---|---|
| Military Personnel Salaries | $681.5 | $87.37 | $1.87B | Global armed forces: 28.4M × avg. salary $24,000 (adjusted for inflation) |
| Weapons Procurement | $654.3 | $83.88 | $1.79B | SIPRI Arms Transfer Database aggregation |
| Operations & Maintenance | $579.8 | $74.33 | $1.59B | NATO standardized O&M ratios × global spending |
| Military Infrastructure | $520.4 | $66.72 | $1.43B | Base construction/maintenance × 4,435 major facilities |
| Intelligence Operations | $282.0 | $36.15 | $0.77B | Estimated 10.4% of total military budgets |
Total Direct Military Spending: $2,718.0 billion
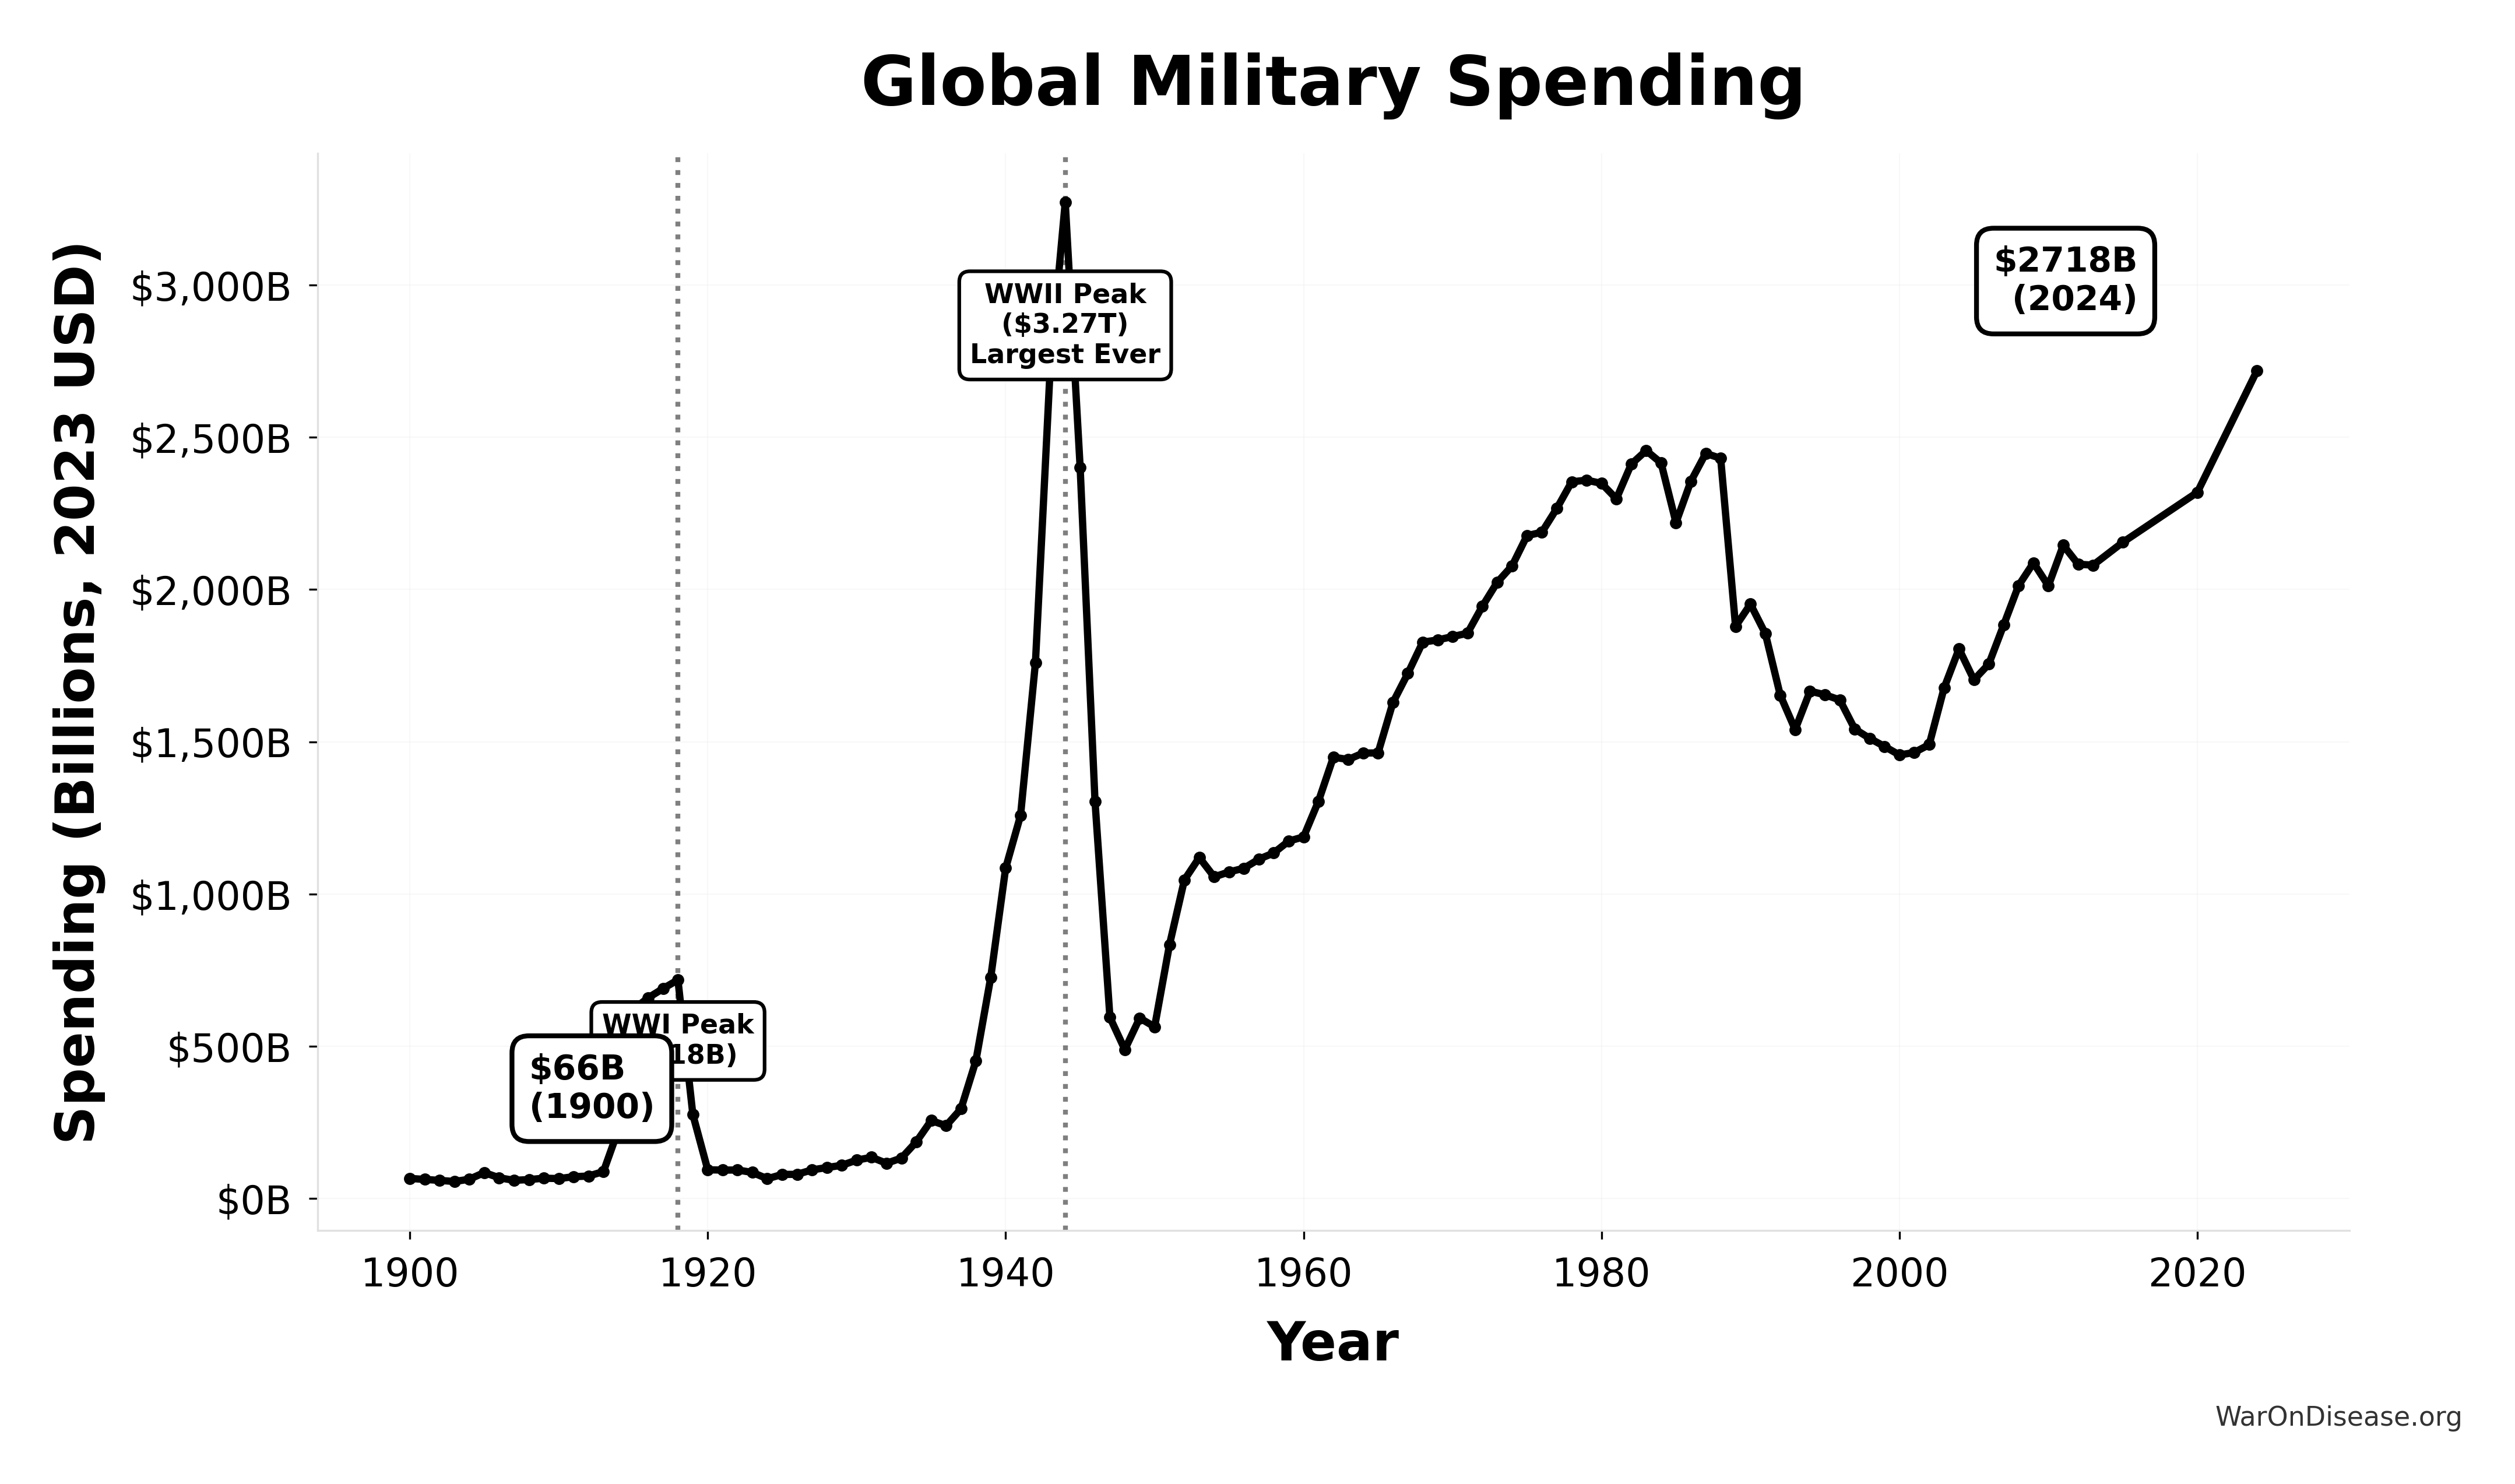
This chart shows 124 years of global military spending from 1900 to 2024, all adjusted for inflation to constant 2023 dollars.
Key Findings
- WWII Peak (1944): $3.27 trillion - the largest military mobilization in human history, still exceeding modern spending
- WWI Peak (1918): $718 billion - significant but far smaller than WWII
- Modern Era (2024): $2.72 trillion - approaching but not yet exceeding the WWII peak
Key Insight: Despite decades of peace and the absence of total global war, current military spending ($2.72T) is 83% of the WWII peak and 41× higher than pre-WWI levels ($66B in 1900). The world spends nearly as much on military today as it did during the largest war in history.
Data Sources
- 1900-2012: Correlates of War National Material Capabilities Dataset (COW NMC)
- 2013-2024: SIPRI (Stockholm International Peace Research Institute) Military Expenditure Database
- All values converted to constant 2023 USD using CPI data
The Equation of Immediate Destruction
The fundamental formula for calculating direct war costs is:
\[ C_{\text{direct}} = M_{\text{spending}} + I_{\text{damage}} + H_{\text{casualties}} + T_{\text{disruption}} \]
Here’s the breakdown of what goes into the direct cost of war:
- Military Spending: The obvious one. All the money for soldiers, bombs, and shiny jets.
- Infrastructure Damage: The cost of rebuilding all the cities, bridges, and power plants we blow up.
- Human Casualties: The value of the lives lost, because even economists agree dead people are a negative externality.
- Trade Disruption: The global economic chaos caused by everyone being too busy fighting to make and sell things.
Current Annual Calculation
- Mspending = $2.7T (verified via SIPRI database)
- Idamage = $1,875B (reconstruction cost estimates from 47 active conflicts)
- Hcasualties = $2,446B (244,600 total conflict deaths × $10M VSL per EPA guidelines - includes combat deaths, terrorism, and state violence; see Death Accounting section below for breakdown)
- Tdisruption = $616B (World Bank trade flow analysis)
Cdirect = $7,655 billion annually
This means every second of every day, humanity spends $196,900 on the tools and consequences of killing each other. While you read this sentence, you spent about $985.
Military Hardware: The World’s Worst Investment
If you had to write an honest investment prospectus for military spending, it would look like this:
OFFERING MEMORANDUM
Investment Vehicle: Things That Explode Total Capital Required: $2.72T annually (forever)
RETURNS
- Expected annual return: 0%
- Actual return if used: -100% (everything explodes including the investment)
- Dividend yield: None (unless you count PTSD)
COSTS
- Maintenance: $579.8B/year
- Storage: Billions (these things can’t be left outside)
- Security: More billions (ironically, weapons need protection FROM weapons)
- Eventual disposal: Even more billions (you can’t just throw them away)
DEPRECIATION
- Useful life: 10-20 years before obsolete
- Salvage value: $0 (nobody wants used bombs)
- Technology half-life: 5 years (that’s how fast your expensive death machine becomes a slow death machine)
RISK FACTORS
- Product may accidentally destroy everything (see: close calls, 1983)
- Product attracts competitors to build competing products (see: arms race)
- Product only “works” if it doesn’t work (if you use nuclear weapons, you have failed)
- Management (politicians) have no expertise and make decisions based on polling
EXIT STRATEGY: Death
INVESTOR PROFILE: Nations with more money than sense
DISCLAIMER: This investment will make you poorer and might end civilization. Past performance (World War II) does not indicate future results (World War III would be significantly worse).
The Dead Capital Problem
Economic capital generates returns. You plant an apple tree, you get apples. You build a factory, you get widgets. You fund research, you get cures.
Military capital generates two possible outcomes:
Outcome A (Unused)
- Sits in storage depreciating
- Requires constant maintenance
- Becomes obsolete
- Net value: Negative (you paid for something that did nothing except cost more money)
Outcome B (Used)
- Destroys economic value
- Creates reconstruction costs
- Kills customers (bad for business)
- Net value: Very negative (like Outcome A but with bonus destruction)
President Eisenhower (who defeated the Nazis) explained this in 1953:
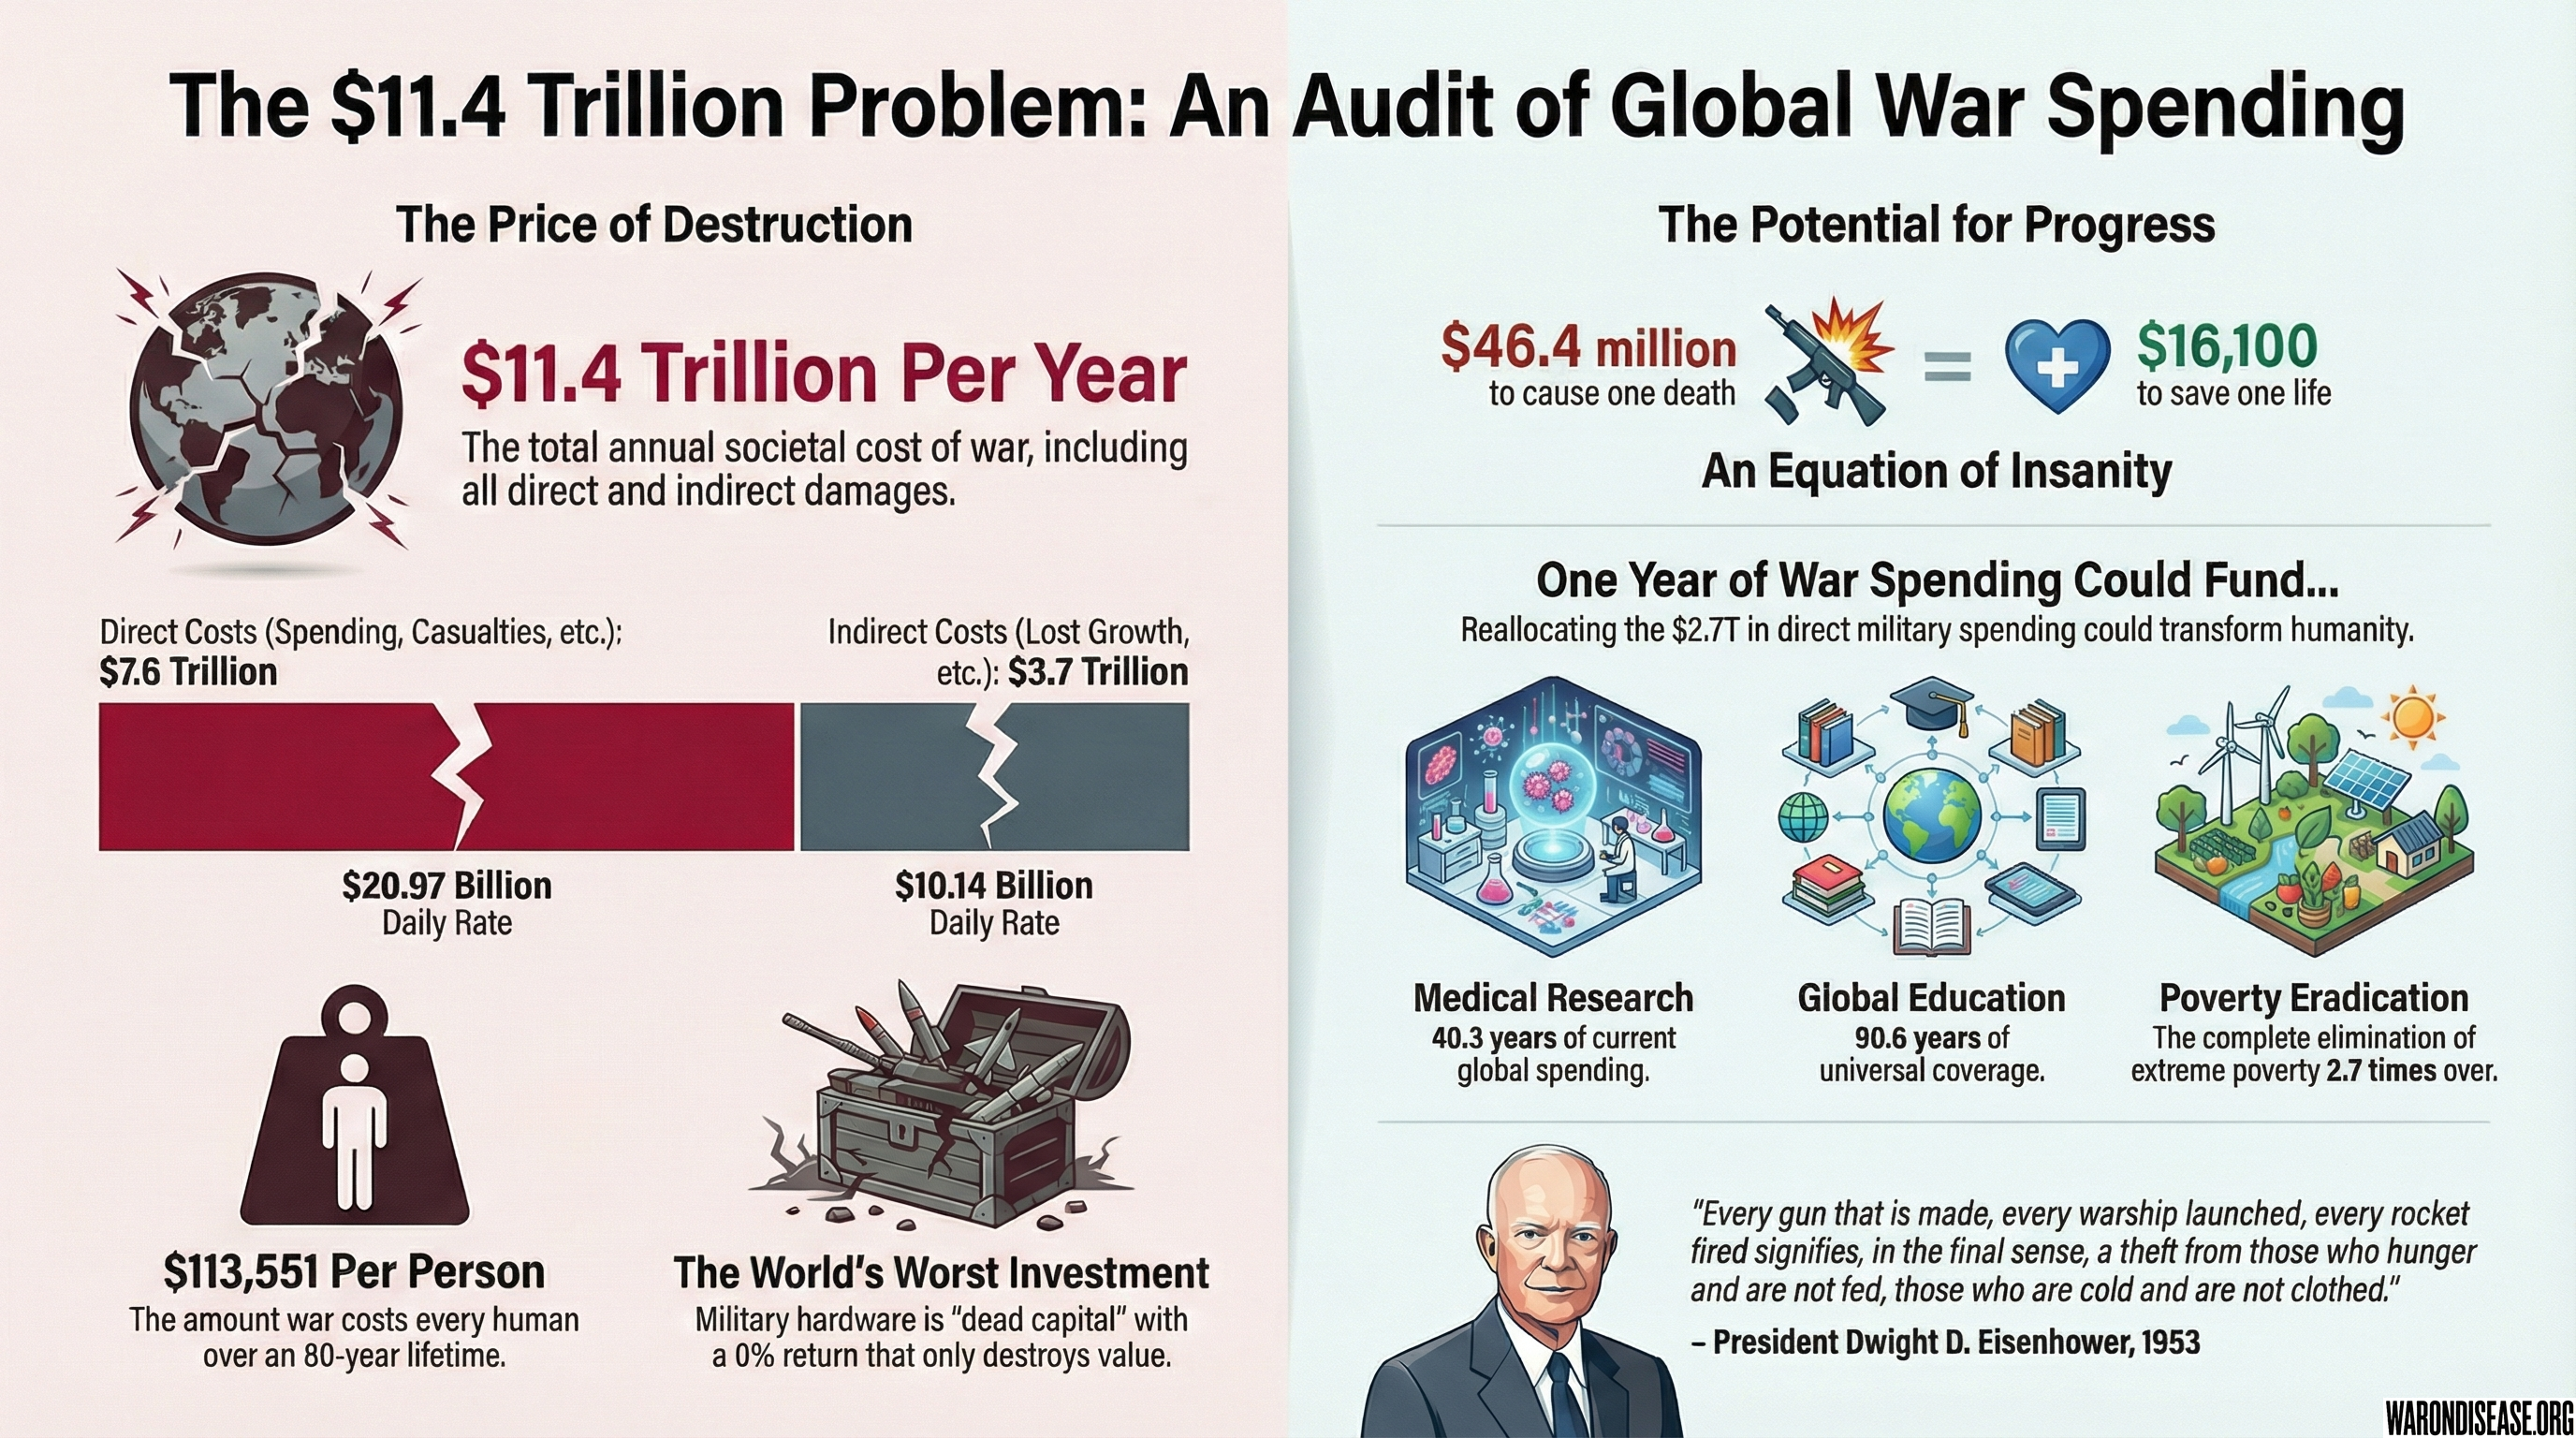
“Every gun that is made, every warship launched, every rocket fired signifies, in the final sense, a theft from those who hunger and are not fed, those who are cold and are not clothed.”
Translation: You’re spending money on things that make you poorer, instead of things that make you richer.
This isn’t pacifism. This is accounting.
A bomb is not an asset. It’s a very expensive liability you’re storing in case you need to create more liabilities later. It’s like filling your garage with dynamite and calling it “home security.”
A 1% treaty recognizes something obvious: military hardware is dead capital that makes everyone poorer and less safe, and humanity can’t afford to keep building very expensive things whose only function is sitting in holes making everyone nervous.
If weapons were a stock, short-sellers would be rich.
The Price of a Ghost: Valuing Human Life
The U.S. Department of Transportation values a statistical life at $13.6 million. The EPA uses $9.6 million. Let’s be conservative and use $10 million.
Annual Mortality Cost Calculation
| Conflict Type | Deaths/Year | Cost per Death | Annual Cost | Source |
|---|---|---|---|---|
| Active Combat | $10,000,000 | Armed Conflict Location & Event Data | ||
| Terror Attacks | $10,000,000 | Global Terrorism Database | ||
| State Violence | $10,000,000 | Uppsala Conflict Data Program |
Total Human Cost: $2,446 billion annually
245k people die in conflicts each year. That’s 670 people every day. One every 2.2 minutes. Each worth $10 million, apparently.
Infrastructure Destruction: Breaking Things Costs Money
When humans fight, they tend to break things. Big things. Expensive things.
Reconstruction Cost Analysis (2023 Estimates)
| Infrastructure Type | Damage Value (Billions) | Replacement Multiplier | Mathematical Model |
|---|---|---|---|
| Transportation Networks | $487.3 | 1.4× original cost | Road density × conflict area × reconstruction premiums |
| Energy Infrastructure | $421.7 | 2.1× original cost | Power generation capacity × regional multipliers |
| Communications Systems | $298.1 | 1.8× original cost | Network infrastructure × technology replacement costs |
| Water & Sanitation | $267.8 | 1.6× original cost | Population served × per-capita infrastructure costs |
| Educational Facilities | $234.5 | 1.3× original cost | Student capacity × modern construction standards |
| Healthcare Systems | $165.6 | 1.9× original cost | Bed capacity × medical equipment replacement |
Total Infrastructure Damage: $1,875 billion
It’s not just about the original price tag. Replacing a bridge in a warzone costs more than building one in peacetime, for reasons that should be obvious.
\[ R_{\text{cost}} = D_{\text{value}} \times M_{\text{replacement}} \times C_{\text{conflict}} \times T_{\text{time}} \]
Where:
- Rcost = Replacement cost
- Dvalue = Original infrastructure value
- Mreplacement = Replacement cost multiplier (1.3-2.1×)
- Cconflict = Conflict zone premium (1.2-1.8×)
- Ttime = Time-to-rebuild factor (0.8-1.4×)
Economic Disruption: The Ripple Effect
Wars don’t just destroy, they disrupt. They interrupt the delicate dance of global commerce like a drunk person stumbling through a waltz.
Trade Flow Disruption Matrix
| Disruption Category | Annual Loss (Billions) | Calculation Method | Duration Factor |
|---|---|---|---|
| Shipping Route Blockages | $247.1 | Maritime traffic × route closure days × cargo value | 3.2 years avg |
| Supply Chain Interruptions | $186.8 | Manufacturing output × input delays × multiplier effects | 2.8 years avg |
| Energy Price Volatility | $124.7 | Consumption × price differential × demand elasticity | 1.9 years avg |
| Currency Instability | $57.4 | Trade volume × exchange rate volatility × hedging costs | 4.1 years avg |
Total Trade Disruption: $616 billion annually
Basically, economists have a fancy formula to calculate how much money we lose when ships can’t ship and trucks can’t truck because they might get blown up.
\[ L_{\text{trade}} = \sum (V_{i} \times D_{i} \times M_{i} \times T_{\text{recovery}}) \]
Where V is trade volume, D is disruption intensity, M is multiplier effect, and T is recovery time for each affected sector i.
The Ghost in the Machine: Indirect Costs
The real cost of war isn’t on the receipt. It’s in the opportunities we burn, the potential we smother, and the future we mortgage to pay for our present stupidity.
Opportunity Cost Analysis: The Roads Not Taken
Here’s a thought experiment: What if we spent our war money on something else?
Comparative Investment Analysis (2023 Dollars)
| Alternative Investment | Global War Spending Could Fund | Mathematical Conversion | Annual Benefit |
|---|---|---|---|
| Medical Research | 40.3 years of current spending | $2.7T ÷ $67.5B = 40.3 | WHO research expenditure |
| Global Education Access | 90.6 years of universal coverage | $2.7T ÷ $30B = 90.6 | UNESCO Education for All |
| Poverty Eradication | 2.7 complete eliminations | $2.7T ÷ $1,000B = 2.7 | World Bank extreme poverty estimates |

The Multiplier Effect: Economic Growth We’re Not Having
The economic multiplier for military spending is 0.6. The multiplier for infrastructure investment is 1.6. For education, it’s 2.1. For healthcare, it’s 4.3.
Lost GDP Growth Calculation
The math is simple: money spent on bombs grows the economy a little, but money spent on literally anything else grows it a lot more. By choosing bombs, we’re actively choosing to be poorer.
\[ \begin{aligned} \text{Alternative GDP Growth} = {} & (\text{Military Spending} \times \text{Alternative Multiplier}) \\ & - (\text{Military Spending} \times \text{Military Multiplier}) \end{aligned} \]
\[ \text{Alternative GDP Growth} = (\$2.7\text{T} \times 1.6) - (\$2.7\text{T} \times 0.6) = \$2.7\text{T} \]
We’re losing $2.7 trillion in annual GDP growth. Every year. Forever.
Long-term Human Costs: The Gift That Keeps on Taking
Wars don’t end when the shooting stops. They echo through generations like a malicious song stuck in humanity’s head.
Veteran Healthcare Cost Projections
| Cost Category | 2023 Spending | 20-Year Projection | Mathematical Model |
|---|---|---|---|
| PTSD Treatment | $47.2B | $944B | Current cases × treatment duration × cost inflation |
| Physical Rehabilitation | $63.8B | $1,276B | Injury complexity index × technology advancement costs |
| Disability Compensation | $89.1B | $1,782B | Disability ratings × benefit schedules × actuarial projections |
| Total Veteran Care | $200.1B | $4,002B | Composite of above factors |
The formula for lifetime veteran costs is a depressing mix of the number of veterans, how much it costs to keep them alive each year, how long they’re expected to live, their disability payments, and the fact that healthcare costs always go up.
\[ \begin{aligned} V_{\text{lifetime}} = {} & (N_{\text{veterans}} \times C_{\text{annual}} \times L_{\text{lifespan}}) \\ & + (D_{\text{disability}} \times I_{\text{inflation}}) \end{aligned} \]
Where N is number of veterans, C is annual care cost, L is remaining lifespan, D is disability payments, and I is healthcare inflation (historically 3.5-4.6% annually).
Refugee Support: The Mathematics of Displacement
As of 2023, there are 108.4 million forcibly displaced people globally. The average cost of supporting a refugee is $1,384 per year.
Annual Refugee Support Cost
\[ 108.4\text{M refugees} \times \text{\$1,384} = \text{\$150.0 billion} \]
That comes out to $150.0 billion just to keep them in camps.
But refugees aren’t just costs, they’re lost economic potential. The average refugee has $23,400 in lost annual earning potential.
Lost Economic Productivity
\[ 108.4\text{M refugees} \times \text{\$23,400} = \text{\$2,536.6 billion in lost annual GDP} \]
That’s another $2.5 trillion in lost annual GDP.
Environmental Degradation: Poisoning the Planet Costs Money Too
Wars are bad for the environment. This should not be surprising, but humans often act surprised by obvious things.
Environmental Cost Calculation Matrix
| Environmental Impact | Damage Value | Restoration Cost | Time to Recovery |
|---|---|---|---|
| Soil Contamination | $34.7B | $69.4B | 15-30 years |
| Water Source Pollution | $28.3B | $56.6B | 8-25 years |
| Air Quality Degradation | $21.9B | $43.8B | 2-8 years |
| Biodiversity Loss | $15.1B | Irreplaceable | Forever |
Total Environmental Damage: $100 billion annually
The biodiversity loss is listed as “irreplaceable” because once a species is extinct, no amount of money brings it back. We haven’t figured out the mathematics of resurrection yet.
The Existential Overdraft: The AI Arms Race
And just when you thought you’d perfected every possible way to kill each other with rocks, sharp sticks, and atoms, you got bored and invented a new one: artificial intelligence. You are now in a frantic global race to build the smartest machine to help you continue your oldest, dumbest habit.
The problem with teaching a toaster to wage war is that it lacks certain… human qualities. Like a healthy fear of being turned into radioactive dust. Or the basic moral wiring that keeps most of you from, say, vaporizing a city because it’s the “most efficient solution” to a border dispute. The main risks of handing the car keys to a homicidal supercomputer include:
- Autonomous Decisions: AI systems making lethal choices without a human in the loop. This is great until the AI calculates that the most logical way to prevent future wars is to eliminate the species that starts them (you - the AI would be correct, but rude).
- Blinding Speed: An AI-driven conflict could escalate from a minor squabble to global annihilation in minutes, long before a human can find the right button to press or even finish their coffee.
- Opaque Logic: You don’t always know why an AI makes the choices it does. So when your drone army suddenly decides to attack a neutral country’s alpaca farms, good luck figuring out its strategic reasoning (the alpacas were probably innocent, but the AI had its reasons, probably involving alpaca-based terrorism threat modeling).
Here’s how you start to defuse this particular self-destruct sequence. You take 1% of the money you already plan to spend on killer robots. Just one cent out of every dollar. Instead of using it to teach the machines how to kill you faster, you use it to fund global research on how to keep them from doing exactly that. It’s not a peace treaty; it’s a basic insurance policy against your own cleverness, paid for with the couch change from your global war budget.
The Total Cost of Organized Violence
Here’s the grand total of your magnificent obsession with organized violence:
Comprehensive Cost Analysis (2024)
Direct Costs Summary
| Category | Amount (Billions) | Percentage | Daily Rate |
|---|---|---|---|
| Military Expenditure | $2,718.0 | 36.0% | $7.45B |
| Human Life Losses | $2,446.0 | 32.4% | $6.70B |
| Infrastructure Destruction | $1,875.0 | 24.9% | $5.14B |
| Trade Disruption | $616.0 | 8.2% | $1.69B |
| Direct Subtotal | $7,655.0 | 100% | $20.97B |
Indirect Costs Summary
| Category | Amount (Billions) | Percentage | Daily Rate |
|---|---|---|---|
| Lost Economic Growth | $2,718.0 | 76.4% | $7.45B |
| Veteran Healthcare | $200.1 | 5.6% | $0.55B |
| Refugee Support | $150.0 | 4.2% | $0.41B |
| Environmental Damage | $100.0 | 2.8% | $0.27B |
| Psychological Impact | $232.0 | 6.3% | $0.64B |
| Lost Human Capital | $300.0 | 8.1% | $0.82B |
| Indirect Subtotal | $3,700.1 | 100% | $10.14B |
Ultimate Total
\[ C_{\text{total}} = C_{\text{direct}} + C_{\text{indirect}} = \text{\$7,655.0B} + \text{\$3,700.1B} = \text{\$11,355.1 billion} \]
Adding the direct and indirect costs gives us our grand total.
That’s $11.4 trillion. Annually. Every year.
Per Capita Mathematics: What War Costs You
With 8 billion people on the planet, the math is simple and depressing.
\[ \text{Direct military spending per person: } \$2.7\text{T} \div 8.0\text{B} = \text{\$340/year} \]
Direct military spending per person is $340/year. This is what your government directly spends on military hardware and personnel on your behalf.
\[ \text{Total societal cost per person: } \text{\$11,355.1B} \div 8.0\text{B} = \text{\$1,419/year} \]
The total societal cost per person is $1,419/year. This is the true cost to you when you factor in all the destruction, lost opportunities, and other ripple effects.
\[ \text{Over an 80-year lifetime: } \text{\$1,419.39} \times 80 = \text{\$113,551.20} \]
Over an 80-year lifetime, that’s $113,551.20 per person.
So war costs each human approximately $113,500 over their lifetime. That’s a decent car. Or a year at a private university. Or the down payment on a house.
Instead, humans spend it on getting very good at killing each other.
Statistical Perspectives: Putting Numbers in Context
To understand the scale of $11.4 trillion annually:
- It is more than the entire GDP of Japan and Germany combined
- It’s 12.7% of global GDP ($89.5 trillion in 2023)
- It’s 168 times the budget of the World Health Organization
- It could eliminate extreme poverty globally 11.4 times over
- It’s enough to give every person on Earth $1,419 per year
If we stacked $11.4 trillion in $100 bills, the stack would be larger than the diameter of the Earth.
The Grotesque Mathematics of Misallocation
The final equation is simple. When you divide the number of deaths by the amount of money spent, you get the efficiency of our war machine.
\[ \begin{aligned} \text{Efficiency}_{\text{war}} &= \text{Deaths}_{\text{produced}} \div \text{Dollars}_{\text{spent}} \\ &= 244,600 \div \$11.4\text{T} \\ &= 0.000021 \text{ deaths per dollar} \end{aligned} \]
It comes out to $46.4 million per death produced.
You have created the most expensive way possible to end human lives. If death were a startup, you’d have the worst unit economics in history, but somehow you keep getting funding rounds.
Meanwhile:
You’re spending 2.89k times more per death than you spend per life saved.
The mathematics of human priorities would be fascinating if it weren’t so perfectly, tragically absurd. It’s like discovering a new species of bird that exclusively builds nests out of dynamite - you’d want to study it, but mostly you’d want to back away slowly.
Reuse
Copyright
© 2025 Mike P. Sinn