The 1% Treaty: Health and Economic Impact of Redirecting 1% of Global Military Spending to Pragmatic Clinical Trials
Redirecting 1% of global military spending ($27B/yr) to pragmatic clinical trials advances cure access over 8.2 years saving ~416M lives at ≈$0.13 per DALY and generating ≈$1.19 quadrillion in long-run value.
Abstract
By redirecting 1% of global military spending to hyper-efficient pragmatic clinical trials, humanity can achieve 514 years of medical research in 20 years and shift the cure of every disease forward by 8.2 years, saving 416 million lives and generating $1.2 quadrillion in value.
Keywords
war-on-disease, 1-percent-treaty, medical-research, public-health, peace-dividend, decentralized-trials, dfda, dih, victory-bonds, health-economics, cost-benefit-analysis, clinical-trials, drug-development, regulatory-reform, military-spending, peace-economics, decentralized-governance, wishocracy, blockchain-governance, impact-investing
Version 0.9 - Working Draft
M. Sinn
Last updated: December 2025
Tip
This is a working paper. Comments and critical feedback are appreciated. Annotate via the sidebar or email mike@warondisease.org.
Abstract
A one-time 8.2-year timeline shift in patient access to future cures would save 416M lives, valued at $1.19 quadrillion. This shift can be achieved by redirecting 1% of global military spending ($27.2B/year) to pragmatic clinical trials that allow patient access after Phase I safety trials rather than waiting 8.2 additional years for efficacy confirmation. The intervention delivers healthcare’s most cost-effective option: $0.126/DALY (707× better than malaria bed nets) with ROI between 451:1 (conservative, R&D savings only) and 1.19M:1 (complete estimate including peace dividend). This qualifies as cost-dominant: it reduces costs while improving outcomes.
Impact Mechanism: Eliminating the 8.2-year efficacy-trial delay shifts forward patient access to future cures by 8.2 years. This timeline shift is independent of when discoveries occur. This 8.2-year advancement represents a conservative floor; it excludes additional acceleration from increased research capacity and lowered economic barriers from eliminating phase 2-4 trial costs for pharmaceutical companies. Redirecting $27.2B/year at $500 per patient increases annual trial capacity by 22.8×, compressing 500+ years’ worth of traditional clinical research into 20 calendar years. This removes the primary bottleneck to medical progress: currently less than 1% of willing patients can access trials, and over 9.50k proven-safe compounds (FDA-approved drugs + GRAS substances) remain untested for most conditions they could improve. The total economic value of $1.19 quadrillion uses standard QALY valuation ($150K/QALY) across 416M lives saved and 7.94B DALYs averted.
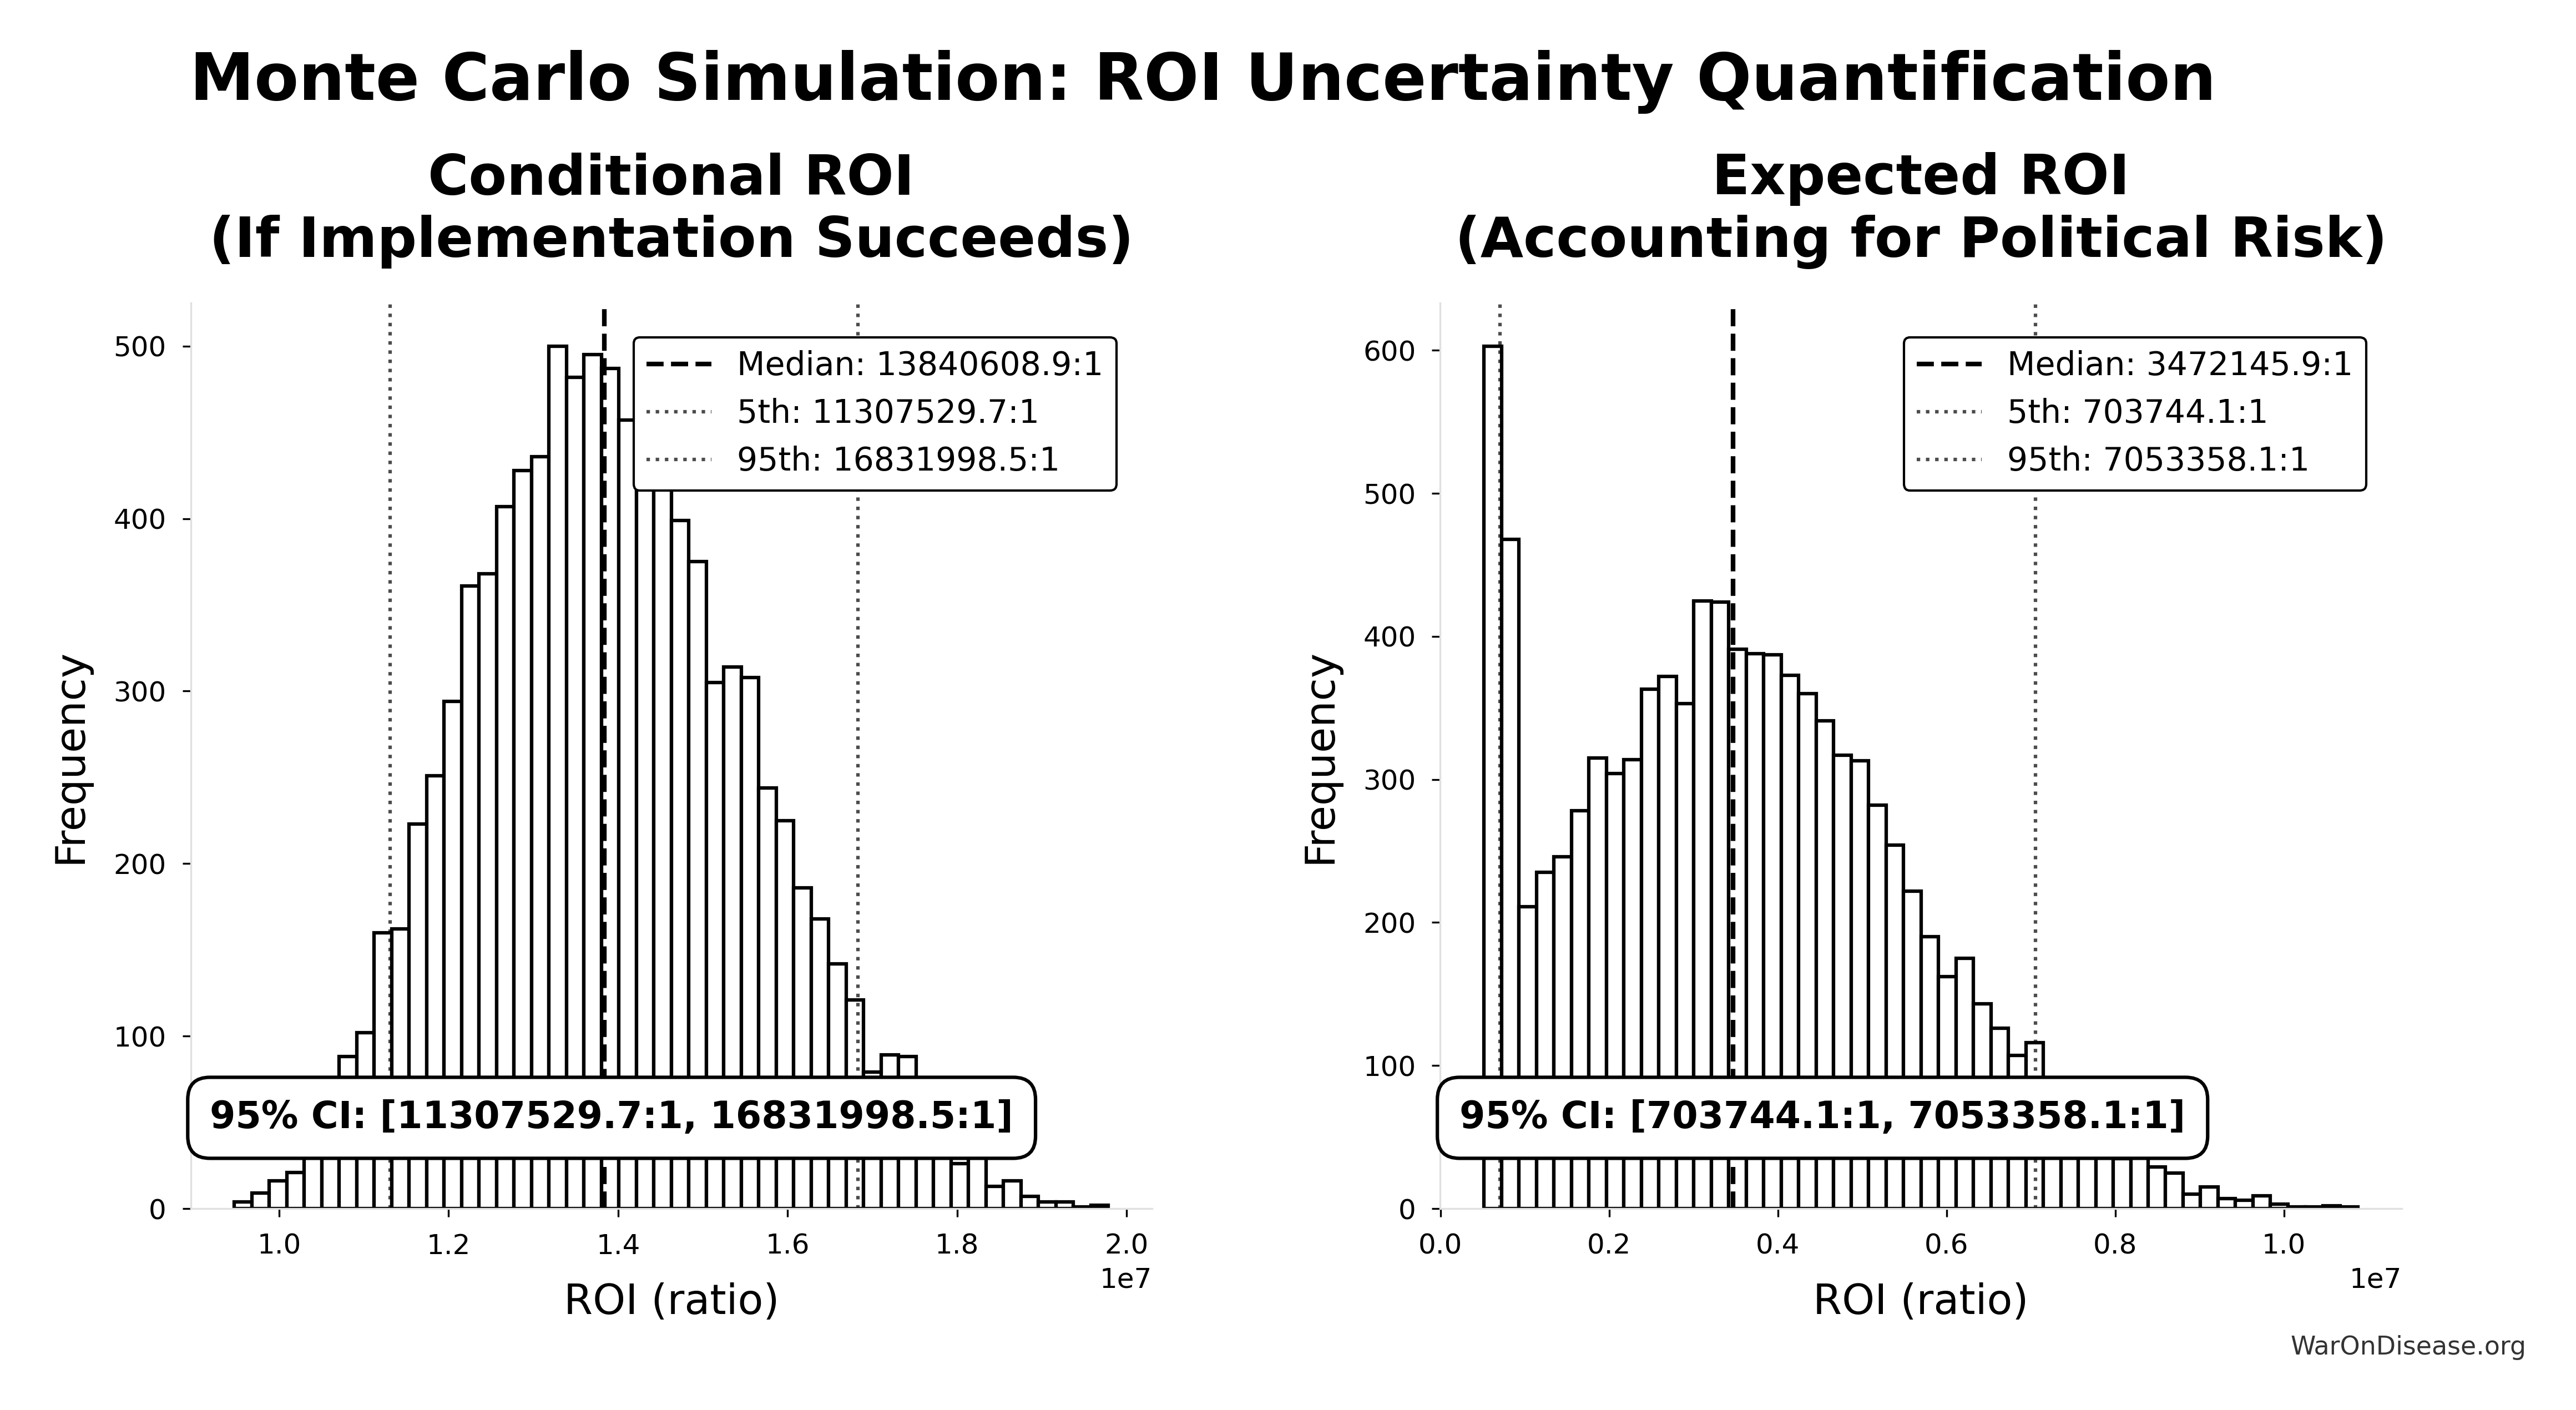
Robustness: Even at 1% probability of adoption, risk-adjusted cost-effectiveness ($13/DALY) remains 7.07× better than bed nets. Monte Carlo simulation across 10,000 trials confirms the intervention maintains cost-dominance under all plausible parameter scenarios.
Methods: Cost-benefit analysis, NPV calculations, QALY modeling, and ICER analysis using SIPRI military expenditure data, WHO mortality statistics, Oxford RECOVERY trial results, and published clinical trial cost literature. Conservative estimates exclude research acceleration effects; complete estimates include all quantifiable benefits. All parameters, data sources, and uncertainty ranges documented in Parameters and Calculations.
Implications: Comparable to history’s most successful public health intervention (smallpox eradication: 280:1 ROI), this intervention represents a dominant strategy that simultaneously addresses military spending inefficiency and medical research bottlenecks.
Keywords: 1% Treaty, pragmatic clinical trials, regulatory delay, cost-effectiveness analysis, DALY, peace dividend
NoteKey Findings
The proposal: Redirect 1% of global military spending ($27.2B/year) to fund pragmatic clinical trials, allowing patients access to treatments after Phase I safety trials rather than waiting 8.2 additional years for efficacy confirmation.
| Metric | Value | Context |
|---|---|---|
| Total Economic Value | 416M lives × standard QALY valuation | |
| Cost-Effectiveness | $0.126/DALY | 707× better than bed nets ($89/DALY) |
| Cost-Effectiveness (Risk-Adjusted) | $13/DALY | At 1% success probability, still 7.07× better than bed nets |
| ROI (Conservative) | 451:1 | Trial cost savings only (82× cheaper per patient) |
| ROI (Complete) | 1.19M:1 | Includes peace dividend from reduced conflict costs |
| Lives Saved | From shifting disease cures 8.2 years earlier | |
| DALYs Averted | Disability-adjusted life years (captures morbidity, not just mortality) | |
| Research Acceleration | 22.8× | 456 research-equivalent years in 20 calendar years |
| Investment Required | Annual benefits ($155B) exceed costs |
Bottom line: Cost-dominant intervention. Saves money while saving lives. Comparable to smallpox eradication (280:1 ROI).
Introduction
Historical Context: When Grand Challenges Succeed
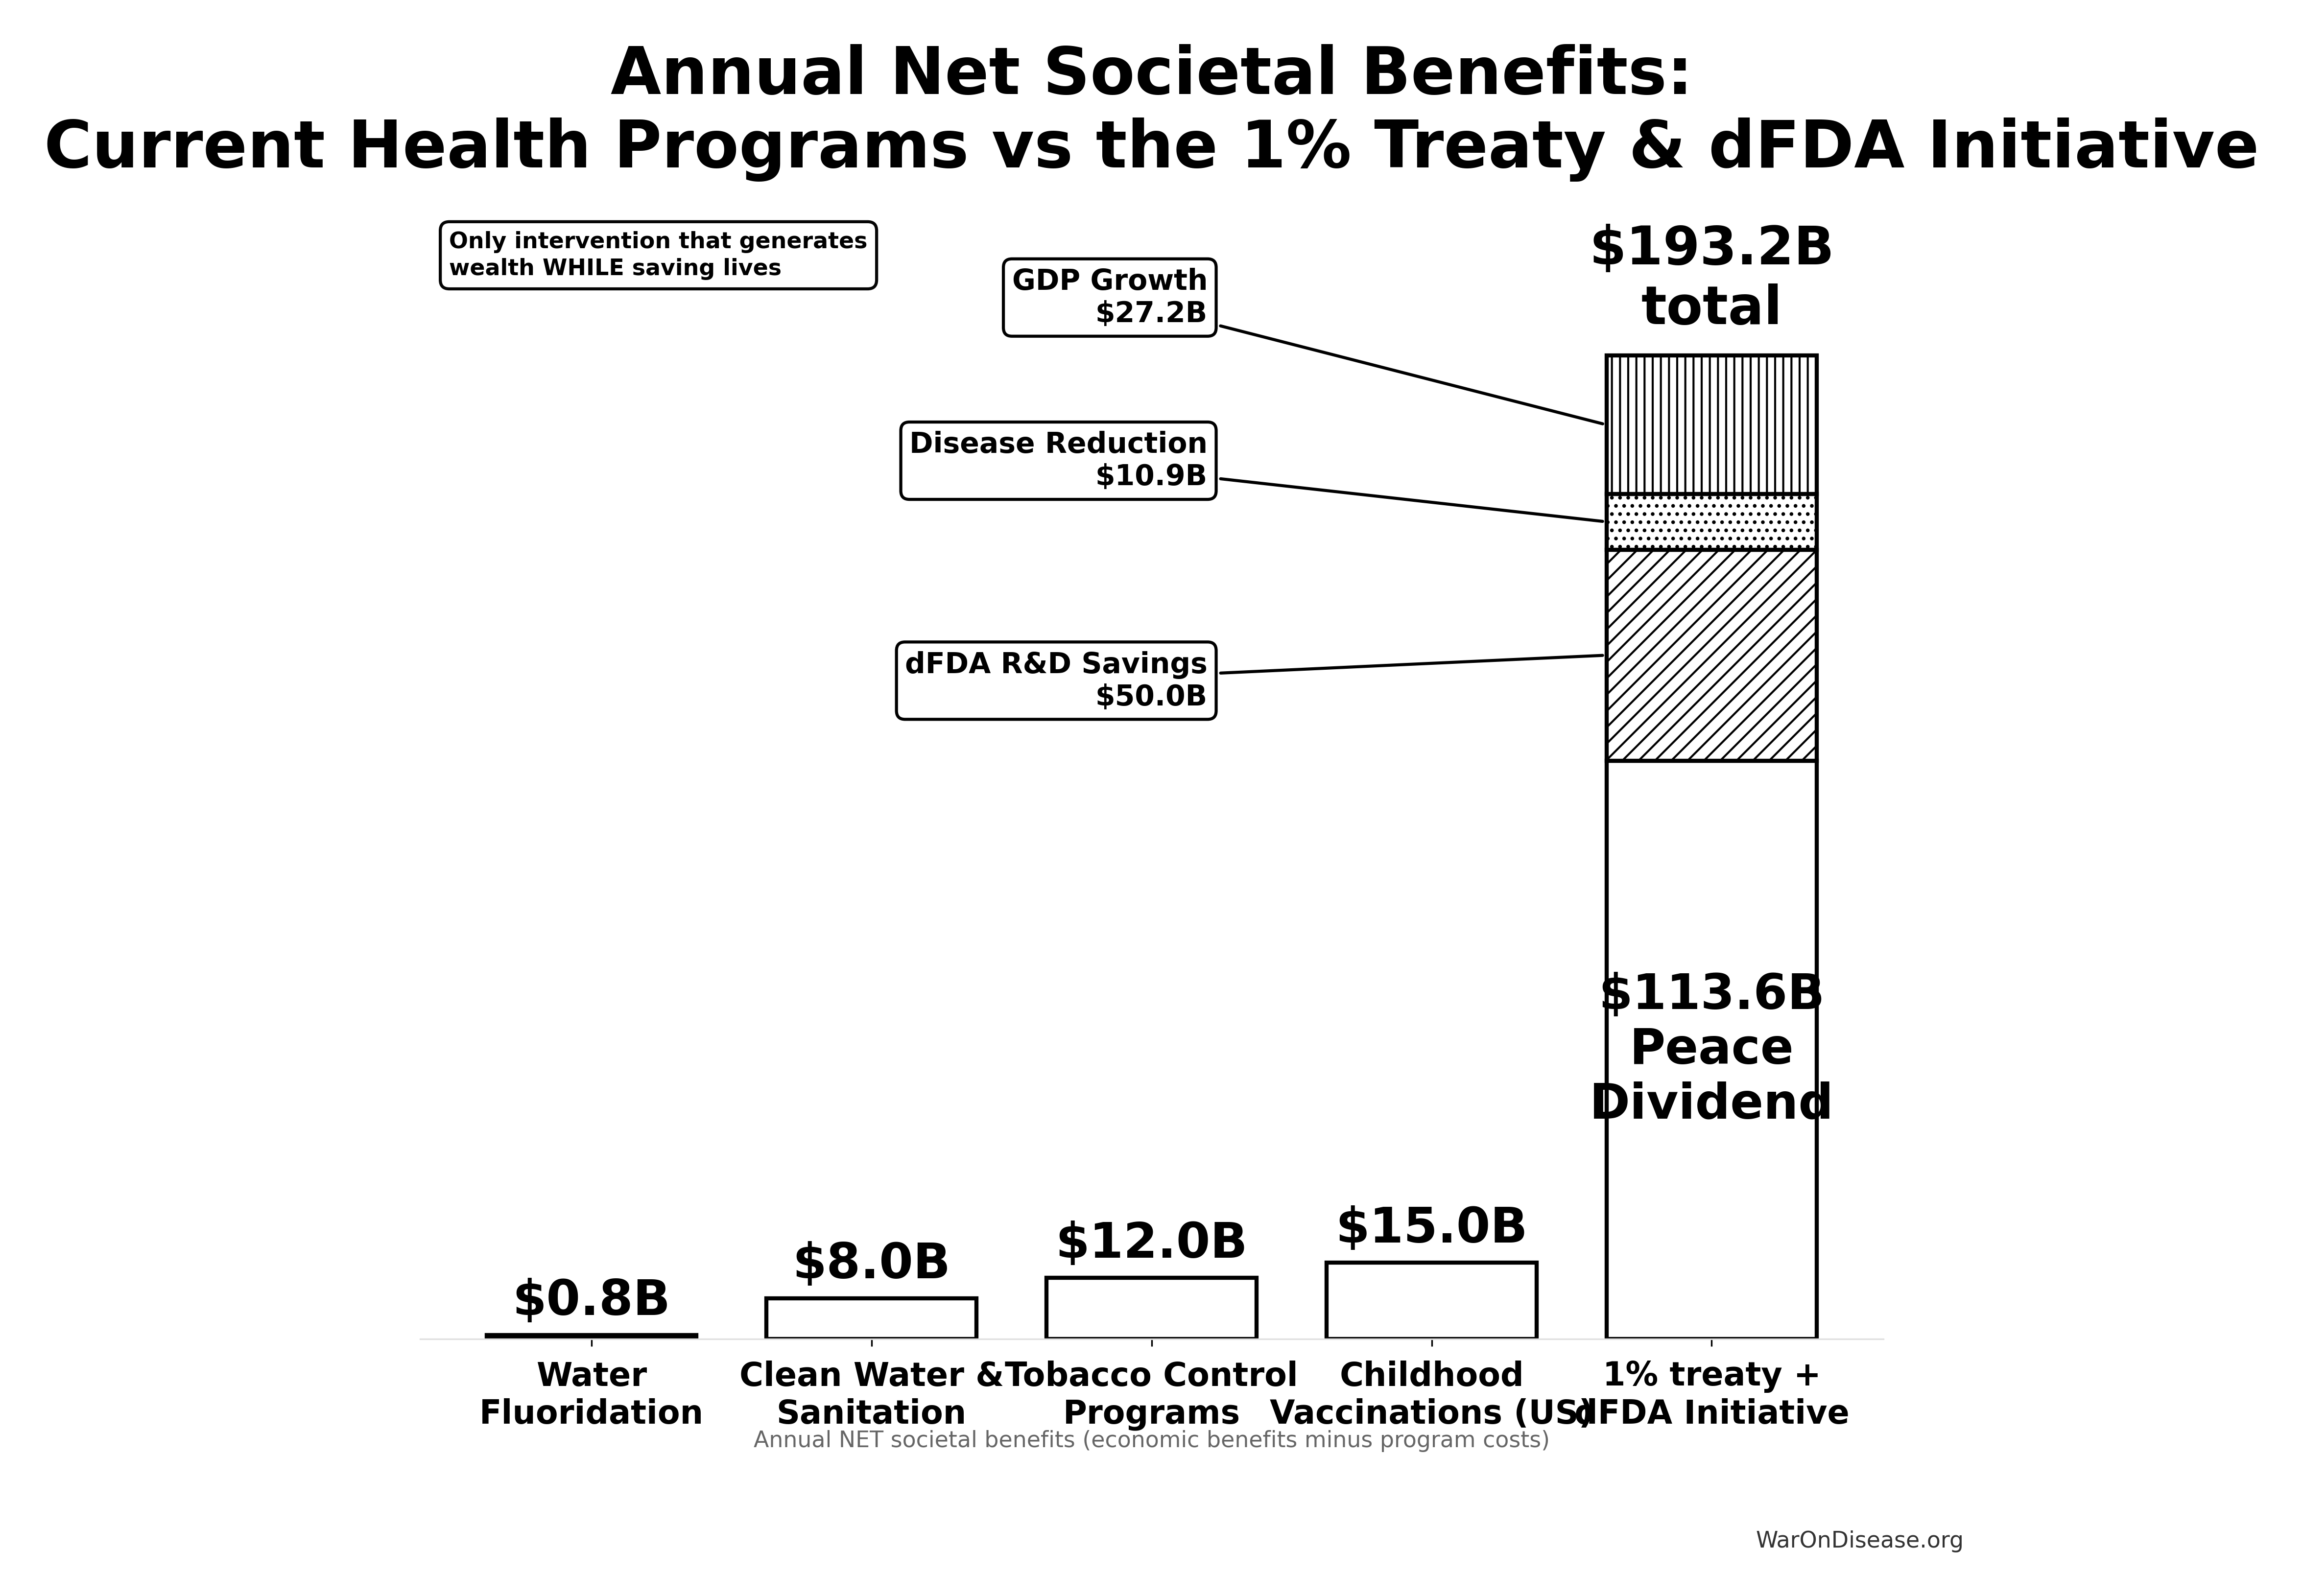
Health economics literature identifies three historical interventions that achieved cost-dominant status (saving money while improving health):
- Smallpox eradication (1967-1980): 280:1 ROI CSIS, eliminating a disease that killed 300-500 million people in the 20th century alone
- Childhood vaccination programs: Self-funding interventions generating $15B in annual economic benefits MMWR (1994)
- Water fluoridation: 23:1 ROI in dental health improvements News (2014)
These successes share common features: systemic interventions that address root causes rather than symptoms, positive externalities that compound over time, and political consensus achieved through demonstrated value. They also share a critical limitation: they targeted specific diseases or conditions. No historical intervention has systematically accelerated the discovery process itself.
The Medical Research Bottleneck
Current medical research faces a fundamental capacity constraint. 0.06% of willing patients can access clinical trials (CAN), and over 9.50k proven-safe compounds (FDA-approved drugs + GRAS substances) remain untested for most conditions they could improve (N. Medicine, 2024). This represents exploration of 0.342% of the theoretically testable drug-disease space. This limitation exists not because promising candidates don’t exist, but because traditional Phase II-III randomized controlled trials cost $41K per patient NCBI, making comprehensive exploration economically infeasible.
The Oxford RECOVERY trial demonstrated that pragmatic trial design can reduce per-patient costs to $500 Oren Cass (2023) while maintaining scientific rigor and delivering results in <100 days (M. Institute). This 82× cost reduction transforms the economics of medical research: what was previously too expensive to test becomes systematically explorable.
Addressing Skepticism: Why This Differs from Failed Megaprojects
Large-scale interventions face legitimate skepticism. The development economics literature documents numerous failures: infrastructure megaprojects that exceed budgets by 50-100%, foreign aid programs with negative or negligible returns, and “grand challenges” that fail to materialize promised benefits.
This intervention differs in four critical ways:
Empirical grounding: Cost estimates based on demonstrated RECOVERY trial results, not theoretical projections. The $500/patient cost is a proven fact, not a forecast.
Decentralized execution: Unlike centralized megaprojects vulnerable to corruption and bureaucratic failure, pragmatic trials distribute decision-making across thousands of physicians and millions of patients. No single point of failure.
Dominant intervention status: Cost-dominant interventions (reducing costs while improving outcomes) are robust to uncertainty in ways that cost-effective interventions are not. Even if health benefits are overstated by 50%, the intervention still saves money.
Aligned incentives: The 1% Treaty uses VICTORY Incentive Alignment Bonds: a single instrument that aligns investors (10% returns), politicians (10% political incentive fund), and patients (80% pragmatic trials) with the same outcome, rather than relying on altruism or bureaucratic mandate.
Contribution to Literature
This paper makes three contributions to health economics literature:
Quantification of regulatory delay costs: First comprehensive estimate of lives lost and economic value foregone due to the 8.2-year efficacy trial delay, valued at $1.19 quadrillion using standard QALY methodology.
Cost-effectiveness analysis under political uncertainty: Demonstrates that even at 1% adoption probability, risk-adjusted cost-effectiveness ($13/DALY) exceeds established interventions like malaria bed nets by 7.07×.
Mechanism design for global public goods: Proposes a self-sustaining funding mechanism that converts military spending (economic multiplier 0.6) into health research (economic multiplier 4.3) through legally-binding treaty with market-based incentive alignment.
The analysis that follows uses standard cost-benefit methodology (NPV, QALY modeling, ICER analysis) applied to SIPRI military expenditure data, WHO mortality statistics, and published clinical trial cost literature. All parameter uncertainty is quantified through Monte Carlo simulation (10,000 trials) with tornado diagrams identifying key drivers of variance.
Research Hypothesis
Primary Hypothesis: Reallocating 1% of global military spending ($27.2B annually) to fund decentralized pragmatic clinical trials generates return on investment between 451:1 (conservative estimate, R&D savings only) and 1.19M:1 (complete estimate, including peace dividend and all direct benefits), representing a dominant health intervention that simultaneously reduces costs while improving health outcomes.
Null Hypothesis (H₀): The intervention does not generate positive net economic value (ROI ≤ 1:1)
Alternative Hypothesis (H₁): The intervention generates substantial positive returns (ROI > 1:1), comparable to or exceeding history’s most successful public health interventions (smallpox eradication: 280:1 CSIS)
Testable Predictions:
- Conservative case: NPV benefit of $275B over 10-year horizon
- Cost-effectiveness: ICER < $0/QALY (cost-saving while improving health)
- Research acceleration: 22.8× increase in completed trials per year
- Self-funding threshold: Annual benefits exceed annual costs by year 3 of implementation
TipNomenclature and Key Terms
NPV (Net Present Value): Economic metric that discounts future cash flows to present-day values, accounting for the time value of money. Used to compare costs and benefits occurring at different times.
QALY (Quality-Adjusted Life Year): Standard health economics measure combining quantity and quality of life. One QALY = one year of life in perfect health. Used to compare health interventions across different conditions.
ICER (Incremental Cost-Effectiveness Ratio): Cost per QALY gained, calculated as (Cost_intervention - Cost_baseline) / (QALY_intervention - QALY_baseline). Negative ICER indicates cost savings while improving health (dominant intervention).
ROI (Return on Investment): Ratio of net benefits to costs. Calculated as NPV(Benefits) / NPV(Costs) for time-adjusted analysis, or Annual Benefits / Annual Costs for simple analysis.
A decentralized framework for drug assessment (dFDA): A regulatory wrapper that automates trial creation, IRB approval, liability insurance, and simultaneous multi-agency submissions (FDA, EMA, PMDA, etc.) across countries. Like TurboTax abstracts away tax code complexity, a dFDA abstracts away regulatory complexity: researchers define hypotheses, and the framework handles compliance. Uses real-world data, electronic health records, and decentralized patient participation. Reduces per-patient costs by 50-95% compared to traditional trials.
decentralized institutes of health (DIH): A pattern for decentralized, programmable, and democratic organizations that implement health initiatives. Your decentralized institutes of health (DIH) can be funded by a 1% Treaty Fund to subsidize patient participation in pragmatic clinical trials.
Peace Dividend: Economic benefits from reduced military spending, including fiscal savings, reduced conflict-related economic damage, and favorable economic multiplier effects from reallocating resources to productive sectors.
Dominant Intervention: Health economics term for interventions that both reduce costs AND improve health outcomes. Unconditionally recommended regardless of willingness-to-pay thresholds (e.g., vaccination programs, smoking cessation).
A 1% Treaty: Proposed international agreement where signatory nations commit to reducing military expenditure by 1% and redirecting those funds ($27.2B globally) to pragmatic clinical trials infrastructure.
A 1% Treaty Fund: The treasury that receives and allocates the 1% of military spending reallocated by the 1% Treaty. It funds pragmatic clinical trials, which can be implemented through networks of decentralized institutes of health.
Pragmatic Clinical Trial: Trial design using real-world settings and broad eligibility criteria rather than highly controlled laboratory conditions. Reduces costs while improving generalizability (e.g., Oxford RECOVERY trial).
Problem Statement
Current Resource Allocation
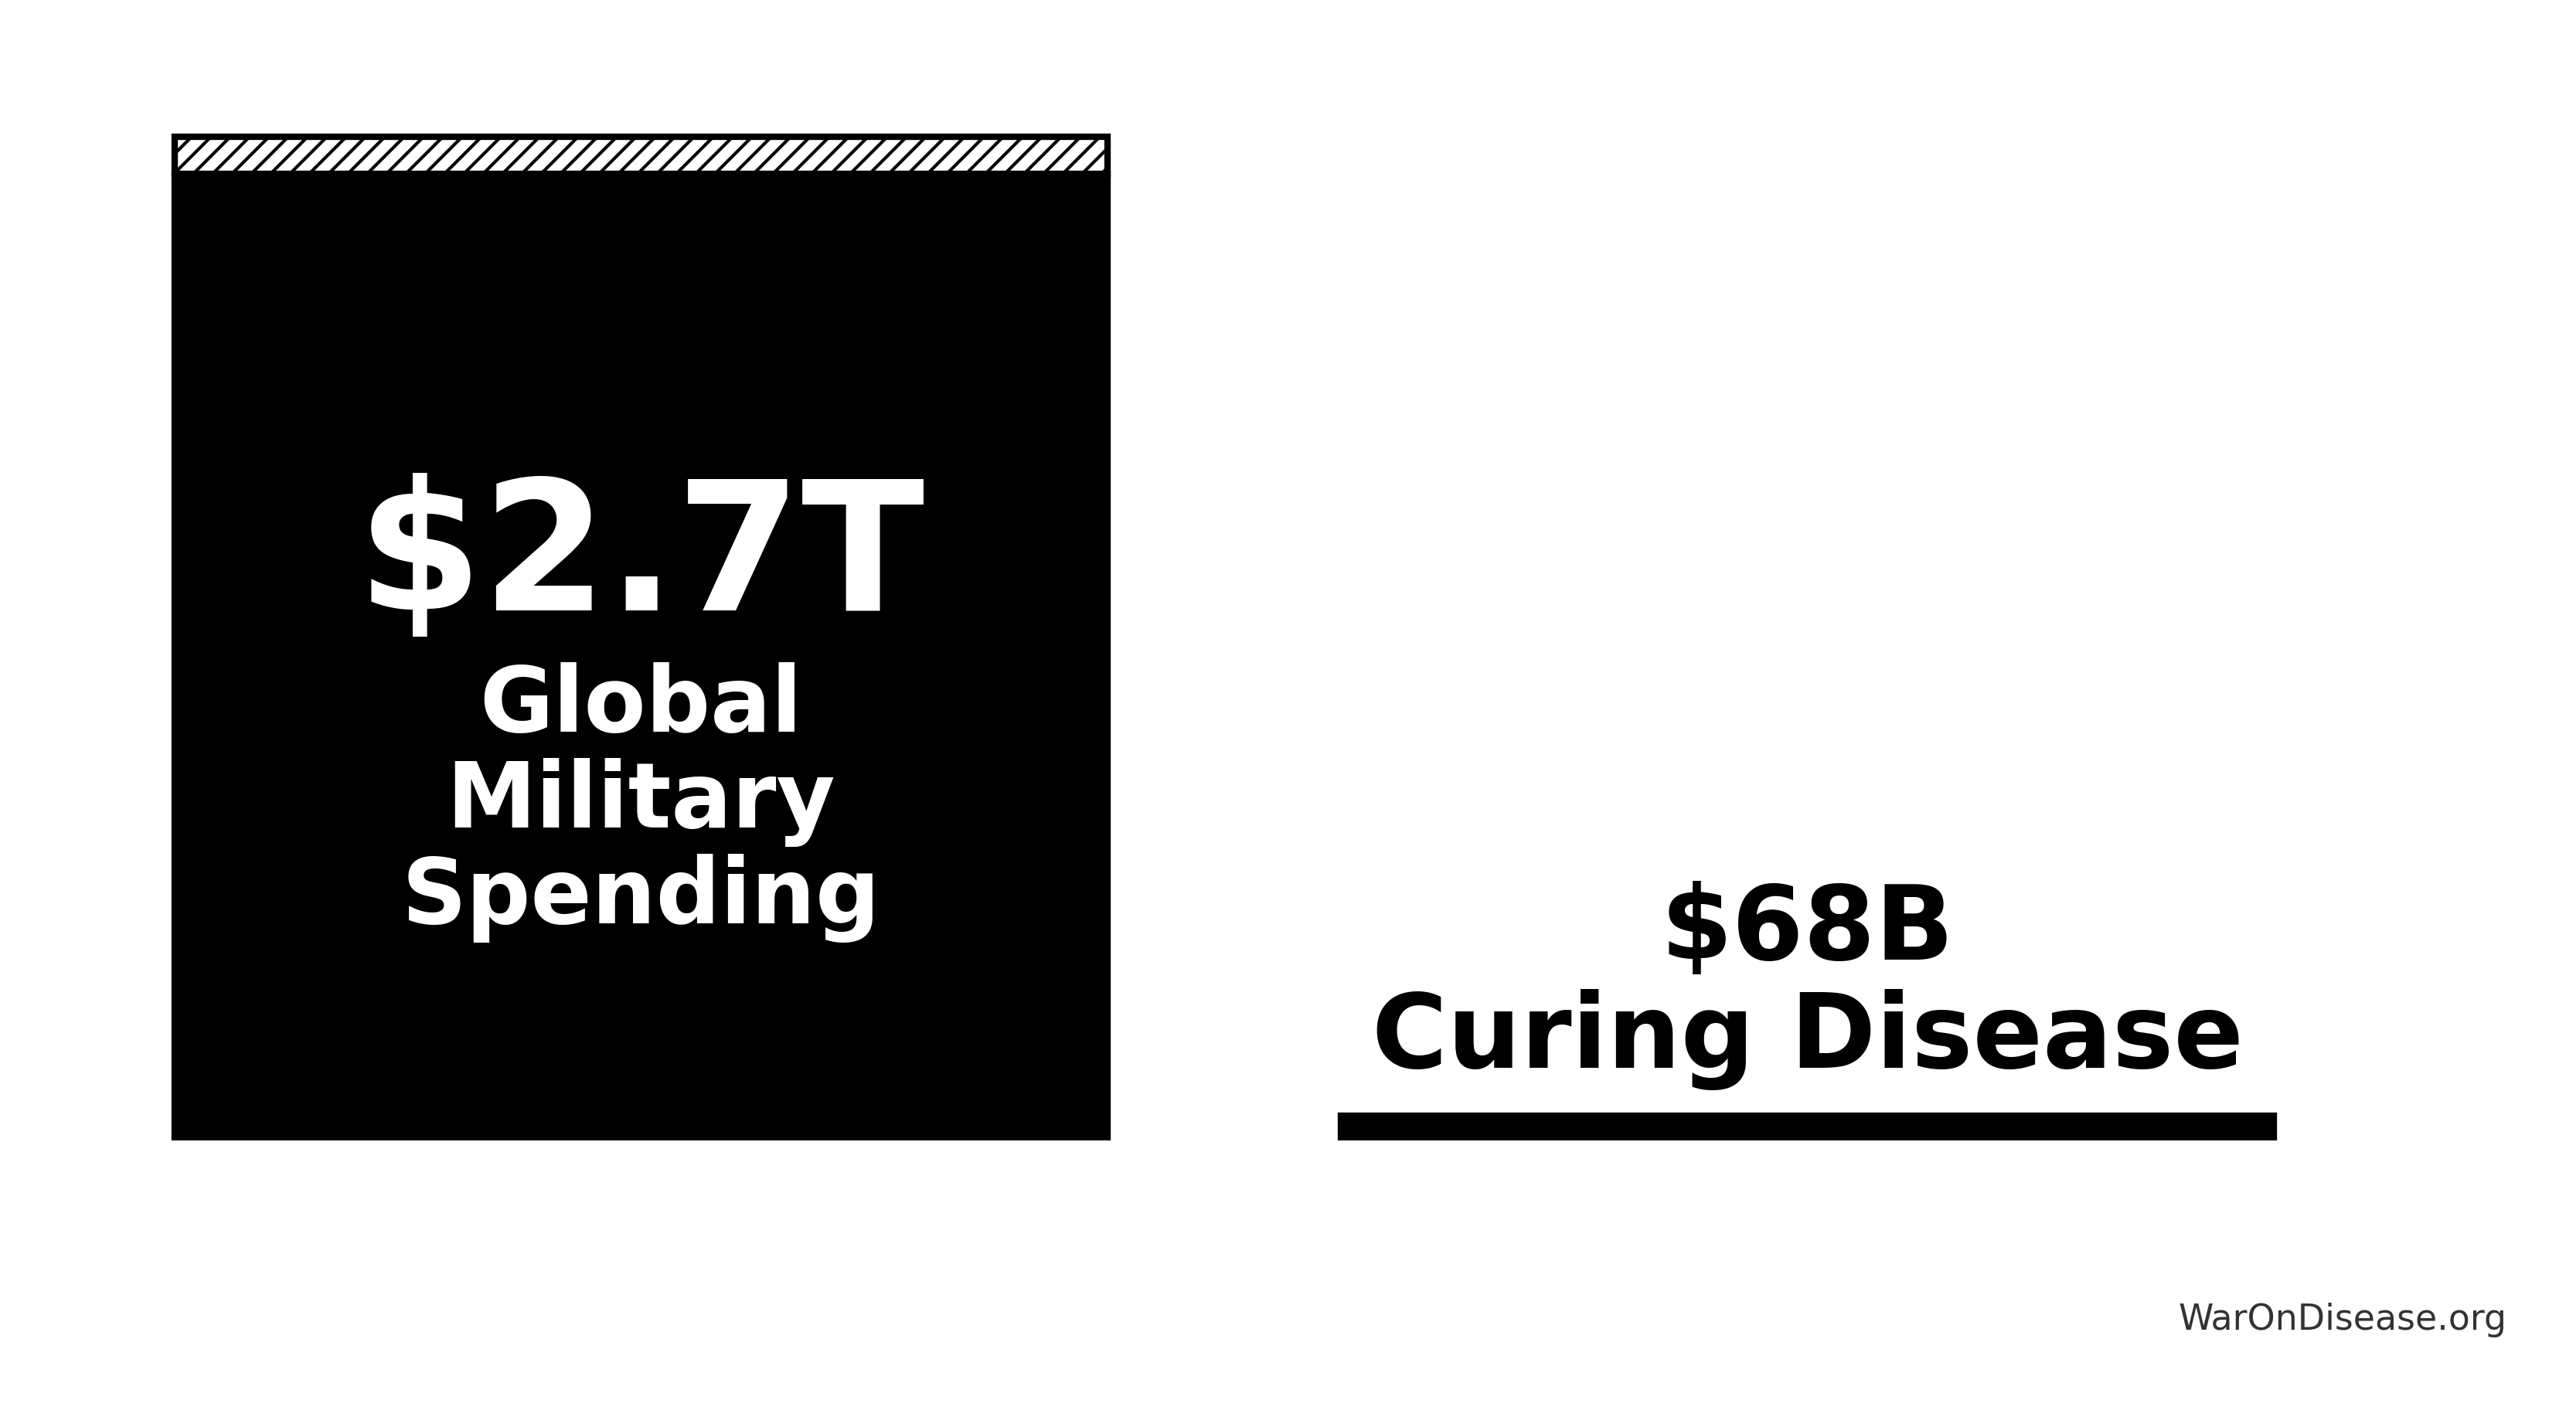
Humanity’s budget priorities, explained simply:
Government clinical trials spending: $4.5B A. C. Trials/year (testing which medicines actually work)
Ratio: 604:1 (you spend 604× more on weapons than on discovering which drugs cure diseases)
Note
Understanding the comparison: While total government medical research spending is $67.5B (including basic research, translational research, and clinical trials), government clinical trial funding is only $4.5B. The 1% treaty redirects $27.2B to pragmatic clinical trials, increasing government clinical trial funding 7-fold (from $4.5B to $31.68B).
The bottleneck isn’t basic research or laboratory science. It’s clinical trials. We’ve tested 0.342% of possible drug-disease combinations using existing safe compounds. Not because the science is impossible, but because traditional trials cost $41K per patient while pragmatic trials like Oxford RECOVERY run for $500 per patient. At current funding levels, testing the remaining 99.7% of therapeutic space would take millennia. Meanwhile, military budgets dwarf the funding needed to automate ubiquitous clinical trials and systematically explore what actually cures people.
Disease treatment vs. curing disease
Symptomatic treatment: $8.20T IHME Global Burden of Disease (2.55B DALYs) & GDP per capita valuation/year (managing symptoms, not fixing root causes)
Disease burden: $109T/year in lost productivity, premature death, disability
Curative research: $67.5B budgets: billion/year
That’s 0.0525% of the disease burden spent on actually fixing the problem:
\[ \frac{\$67.5\text{B}}{\$128.6\text{T}} = 0.052\% \]
Mortality and Morbidity Burden
The World Health Organization reports 150k Based on WHO Global Health Estimates showing 55 million annual deaths / 365 days = 150 (2024) daily deaths from preventable or potentially curable diseases (55.0M annually).
This mortality burden exceeds:
- Annual terrorism deaths by a factor of 18.4k
\[ \frac{54.75\text{M disease deaths}}{3{,}000\text{ terrorism deaths}} \approx 18{,}274:1 \]
- Annual war deaths by a factor of 225:1 (based on 245k conflict deaths annually)
\[ \frac{54.75\text{M disease deaths}}{400{,}000\text{ conflict deaths}} \approx 137:1 \]
Despite this disparity in mortality burden, resource allocation heavily favors security spending over medical research and curative interventions.
How It Works
The mechanism is financial, not bureaucratic:
- Patient subsidies: Most treaty funding ($21.7B) goes directly to subsidizing patient participation in trials at ~$500 Oren Cass (2023) per patient, similar to how insurance covers medical procedures
- Providers get paid: Treatment providers can charge for patient participation in trials, making trials profitable rather than costly
- Easy enrollment: A decentralized framework for drug assessment infrastructure (costing just $40M) makes it easy for anyone to create or join Phase 2/3/4 trials globally
- Patient choice: Patients choose which trials to join; their subsidy follows them. Trials that attract patients get funded. No grant committees deciding what’s “worthy.”
This isn’t “funding infrastructure” - it’s making trial participation financially attractive for both patients and providers while streamlining evidence collection.
A decentralized framework for drug assessment
The economic model assumes integration of pragmatic trial infrastructure into standard healthcare delivery. Every prescription becomes a data point. Every patient visit generates evidence. Every treatment outcome feeds into a continuously-updating system that tells doctors and patients what actually works. Not what pharmaceutical companies claim works, but what measurably happens to real humans taking real treatments.
This architectural shift from centralized regulatory gatekeeping to distributed, real-world evidence generation achieves a 82x cost reduction while providing superior safety monitoring and treatment selection capabilities.
Trial Cost Reduction
Traditional FDA Phase 3 trials cost $41K NCBI per patient because they require dedicated infrastructure: specialized research sites, dedicated research coordinators, custom data collection systems, patient travel reimbursement, and extensive monitoring visits. This overhead exists independent of the actual treatment being tested.
The Oxford RECOVERY trial demonstrated an alternative: leverage existing hospital infrastructure, collect only incremental data beyond standard medical records, and integrate evidence generation into routine clinical care. Cost: $500 Oren Cass (2023) per patient. Same quality evidence. 82x lower cost.
Concrete example: A hospital already tracks patient lab results, symptoms, and outcomes in electronic health records. Traditional trials build a parallel research infrastructure to collect the same information again. Pragmatic trials simply flag which patients are enrolled and automatically extract relevant data from existing systems. No duplicate infrastructure, no dedicated research staff per trial.
The cost reduction stems from eliminating unnecessary overhead, not reducing evidence quality. Hospitals already exist. Electronic health records already exist. Doctors already see patients. The trial infrastructure simply uses what’s already there rather than building dedicated research facilities.
Enhanced Safety Monitoring
Current system pain point: If a drug causes liver damage in 1% of patients, this pattern often goes undetected until 100,000+ prescriptions have been written, because adverse event reporting is voluntary. Doctors must notice the problem, remember to file a report, and actually complete the paperwork. Estimated reporting rate: 1-10% of actual adverse events.
Integrated surveillance alternative: Every prescription automatically becomes a tracked data point. When patients get lab tests or report symptoms at routine visits, the system captures these outcomes. No extra paperwork required. Like how credit card companies detect fraud patterns across millions of transactions in real-time, integrated health systems can detect treatment effects across millions of patients.
The system automatically aggregates outcomes: - 10,000 patients prescribed Drug X → System tracks all subsequent lab results, ER visits, and reported symptoms - 120 patients (1.2%) show elevated liver enzymes within 30 days → Automated flag triggers - Pattern detected after 5,000 prescriptions → Public alert issued, rather than waiting for 100,000+ prescriptions and years of voluntary reports
This isn’t hypothetical. Analogous systems already exist: the Sentinel Initiative monitors 200+ million patients across US health systems for drug safety signals. The difference is making this the default infrastructure for all treatments, not a separate monitoring program.
Comparative Effectiveness Rankings
Current decision-making: Doctor prescribes treatments based on pharmaceutical marketing, medical school training from years ago, and whatever clinical experiences they happen to remember. Patient has no access to comparative effectiveness data.
Evidence-based alternative: Doctor searches “rheumatoid arthritis treatment” in the integrated evidence system, sees treatments ranked by measured effectiveness in real-world patients:
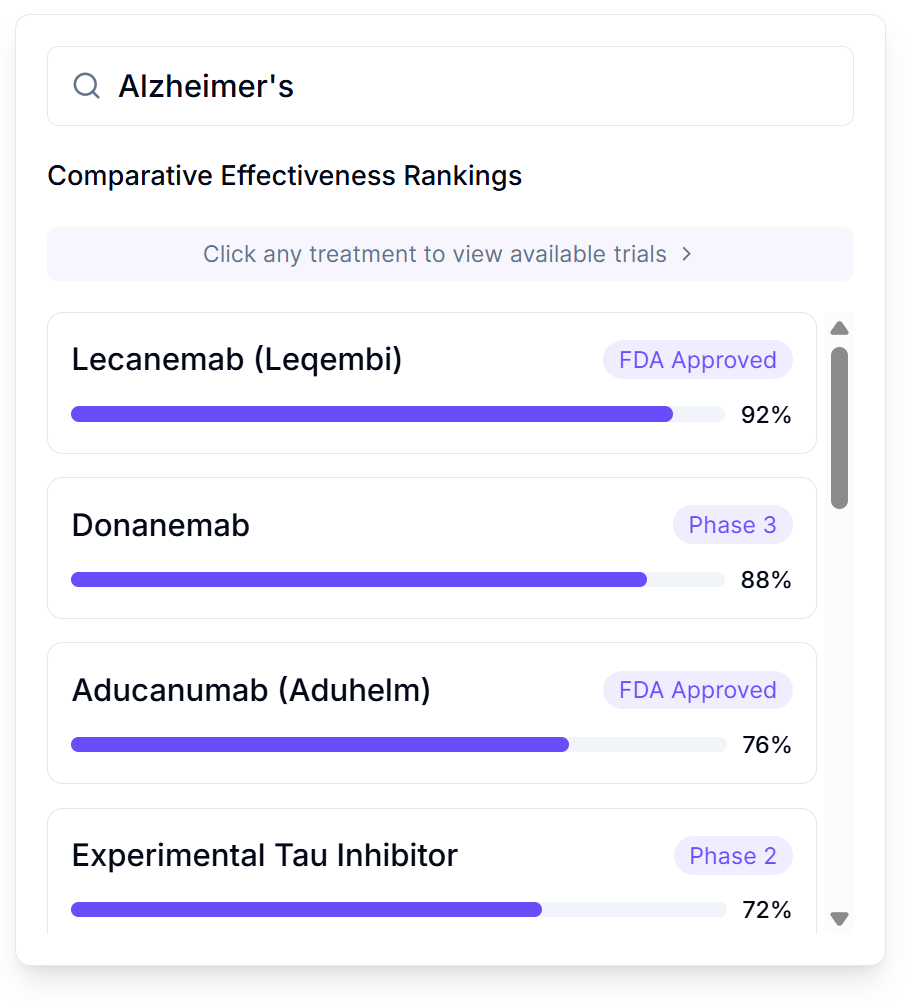
Rankings show frequency and magnitude of outcome changes across actual patient populations. Filters allow stratification: “Show me effectiveness in women over 50 with my patient’s genetic markers and comorbidities.” This precision medicine approach shows what works for patients like yours, not what works on average across everyone.
Like Amazon rankings based on verified purchase reviews, except based on measured clinical outcomes rather than subjective opinions, and stratified by patient characteristics rather than averaged across all users.
Implementation: The system already has prescription records and outcome data from routine care. Ranking is just aggregation and sorting. No new data collection needed, just making existing data actually useful for treatment decisions.
Outcome Labels
Current drug information: 40-page package inserts written by lawyers, listing every possible side effect without quantifying frequencies. Patients have no idea whether “may cause headaches” means 0.1% or 50% of users.
Standardized outcome labels: Quantified summaries of what actually happens to patients taking each treatment, displayed like nutrition labels:
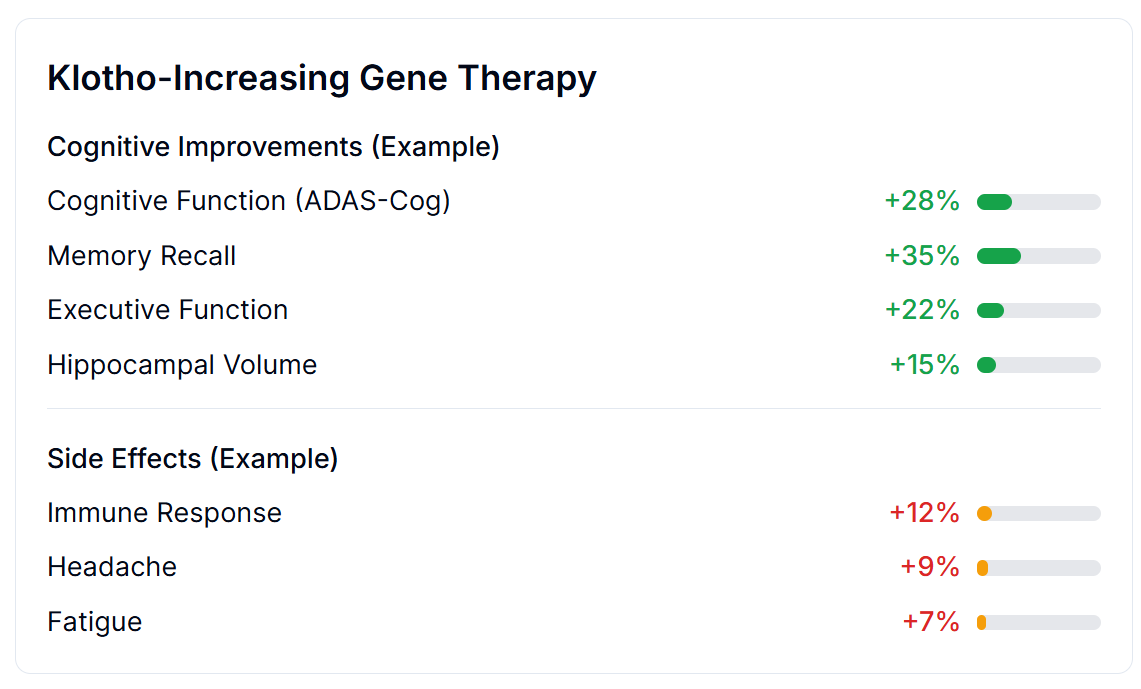
Based on systematic outcome collection across thousands of patients, labels show:
- Quantified benefits: “Memory improved 35%, Executive Function improved 22%”
- Adverse effect frequencies: “Headache: 9% (8% mild, 1% severe); Fatigue: 7%”
- Treatment persistence: “2.3% discontinued due to side effects”
- Sample size and confidence: “Based on 4,200 patients, 95% CI”
This is measured data from actual patient outcomes, not marketing claims or lawyer-drafted disclaimers.
Implementation workflow: 1. Patient prescribed new treatment → Automatically enrolled in outcome tracking 2. Patient reports symptoms at routine visits → Data flows into aggregation system 3. Lab results, ER visits, prescription refills → Automatically captured from electronic health records 4. System aggregates outcomes across all patients taking that treatment → Updates outcome label in real-time 5. Next doctor/patient looking at that treatment sees current evidence, not 5-year-old clinical trial results
No extra paperwork. No dedicated research staff. Just making routine clinical data actually useful for evidence generation.
Summary of Results
Total Economic Value
$1.19 quadrillion in total economic value from eliminating the 8.2-year regulatory delay.
This is the monetized value of 416M lives saved and 7.94B healthy life-years gained by moving disease eradication 8.2 years earlier. It’s a one-time timeline shift, not an annual benefit.
Uncertainty Analysis: Total Economic Value
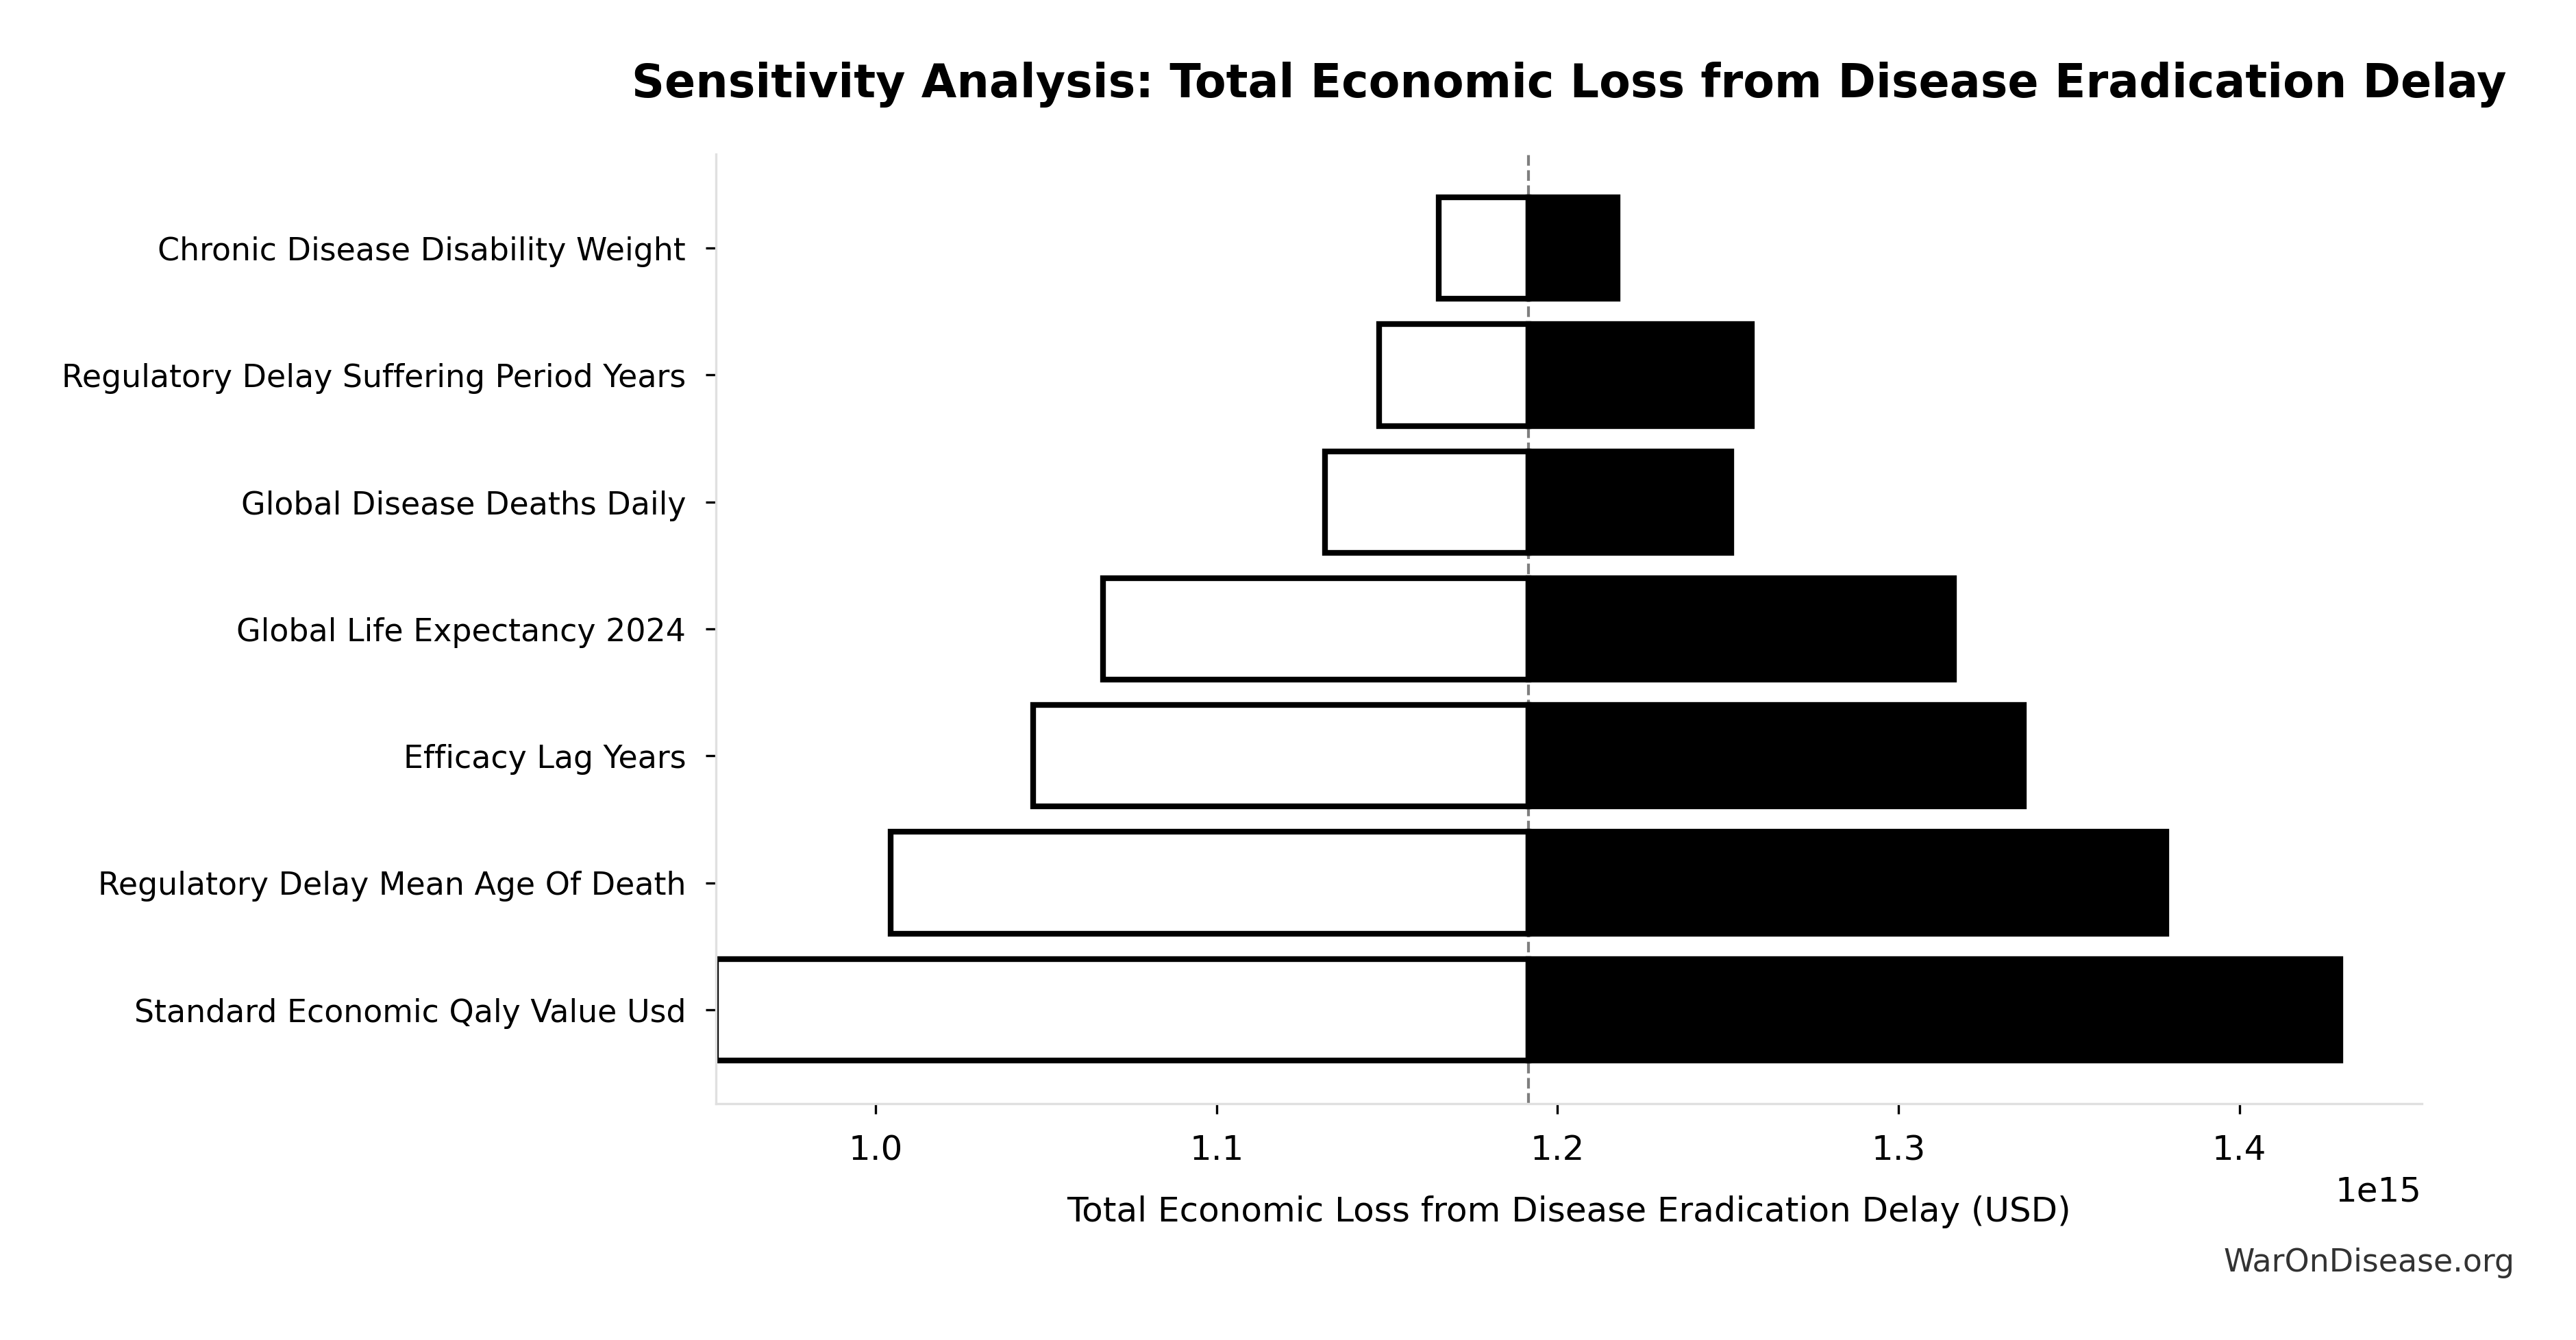
The tornado diagram shows that QALY valuation and efficacy lag duration dominate the uncertainty in total economic value. Even under conservative parameter assumptions, the intervention generates trillions in economic value.
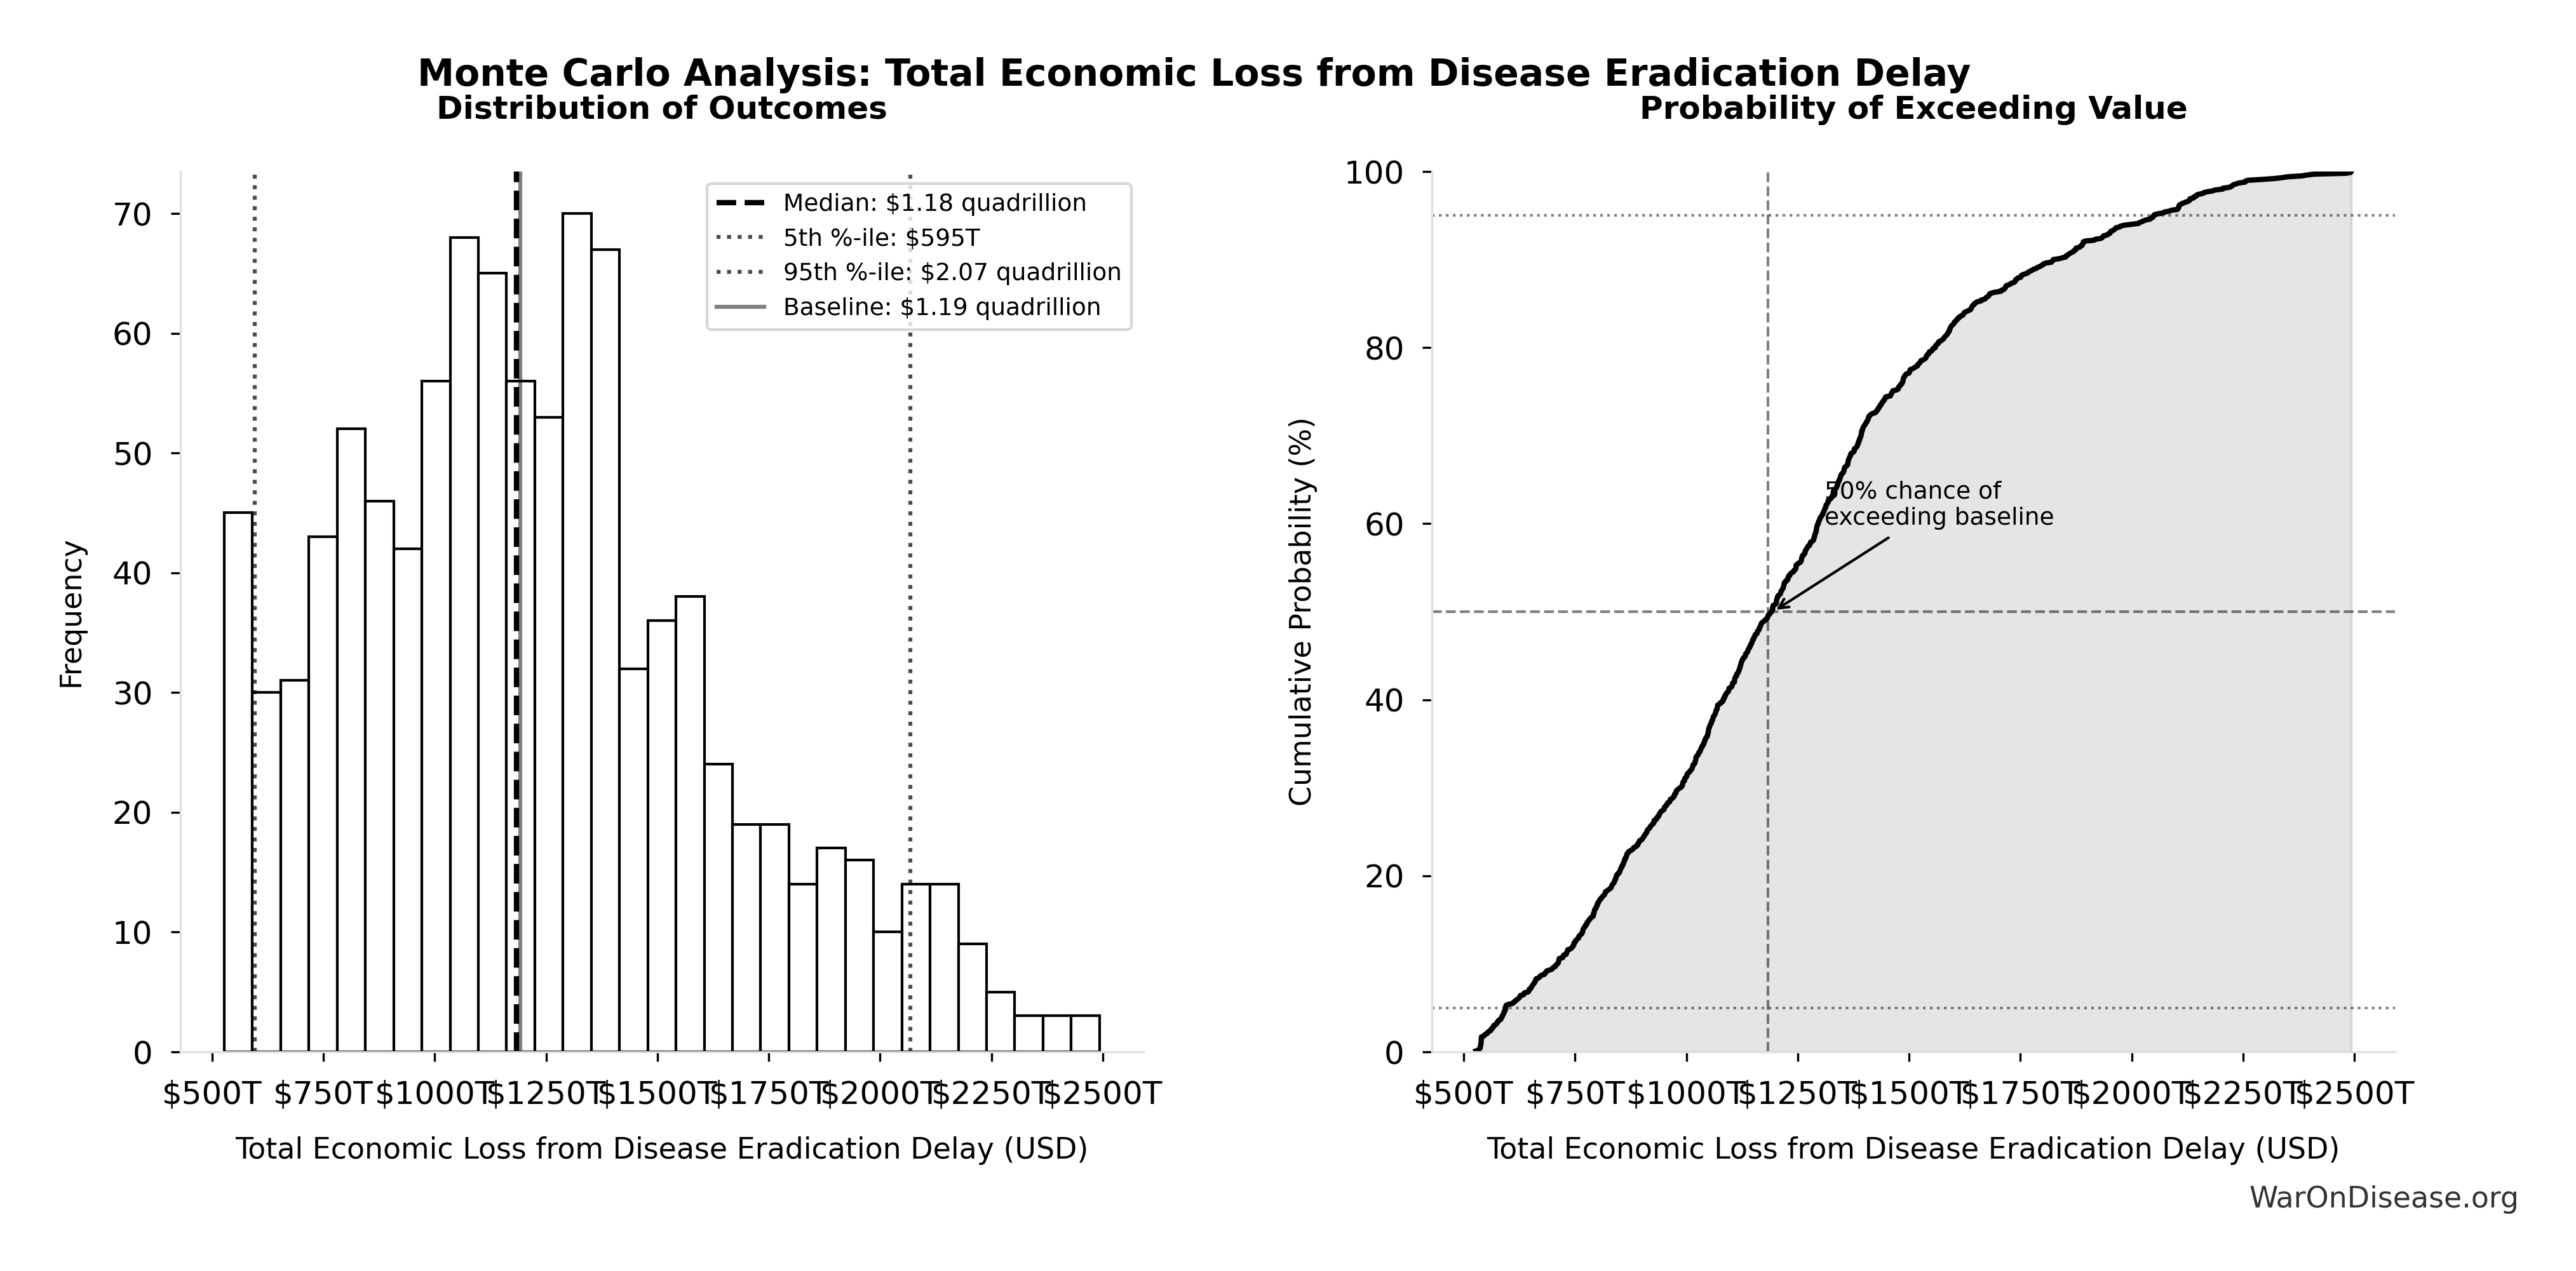
Simulation Results Summary: Total Economic Loss from Disease Eradication Delay
| Statistic | Value |
|---|---|
| Baseline (deterministic) | $1.19 quadrillion |
| Mean (expected value) | $1.24 quadrillion |
| Median (50th percentile) | $1.18 quadrillion |
| Standard Deviation | $426T |
| 90% Confidence Interval | [$595T, $2.07 quadrillion] |
The histogram shows the distribution of Total Economic Loss from Disease Eradication Delay across 10,000 Monte Carlo simulations. The CDF (right) shows the probability of the outcome exceeding any given value, which is useful for risk assessment.
Monte Carlo simulation across 10,000 trials confirms robustness: the 95% confidence interval for total economic value remains in the hundreds of trillions, demonstrating that the one-time timeline shift generates exceptional economic value under all plausible scenarios.
Investment required: $1B
Research Acceleration
22.8× faster medical progress (456 years of medical advancement in 20 years)
\[ Multiplier = \frac{Fundable_{ann}}{Trials_{curr}} = \frac{43.4M}{1.9M} = 22.85 \]
\[ Capacity_{20yr} = 25.7 \times 20 = 514 \text{ years} \]
Suffering Reduction
7.65T hours of human suffering eliminated (one-time benefit from 8.2-year timeline shift)
\[ Hours = 868M \text{ (YLD)} \times 8{,}760 \text{ (hrs/yr)} = 7.60T \]
Lives Saved
416M lives from one-time timeline shift
\[ D_{total} = 54.75M \text{ (annual)} \times 8.2 \text{ (lag)} \times 92.1\% \text{ (avoidable)} = 413.4M \]
- 416M by eliminating 8.2-year post-safety efficacy lag by allowing anyone to participate in efficacy trials and immediately publishing results (one-time benefit)
- 2.45k/year from peace dividend (1% conflict reduction; recurring annual benefit)
For context: 150k people die every day under the current regulatory system waiting for drug approval.
The Monte Carlo distribution below shows the range of lives saved estimates across 10,000 simulations, accounting for uncertainty in efficacy lag duration, daily mortality rates, and avoidable death percentages:
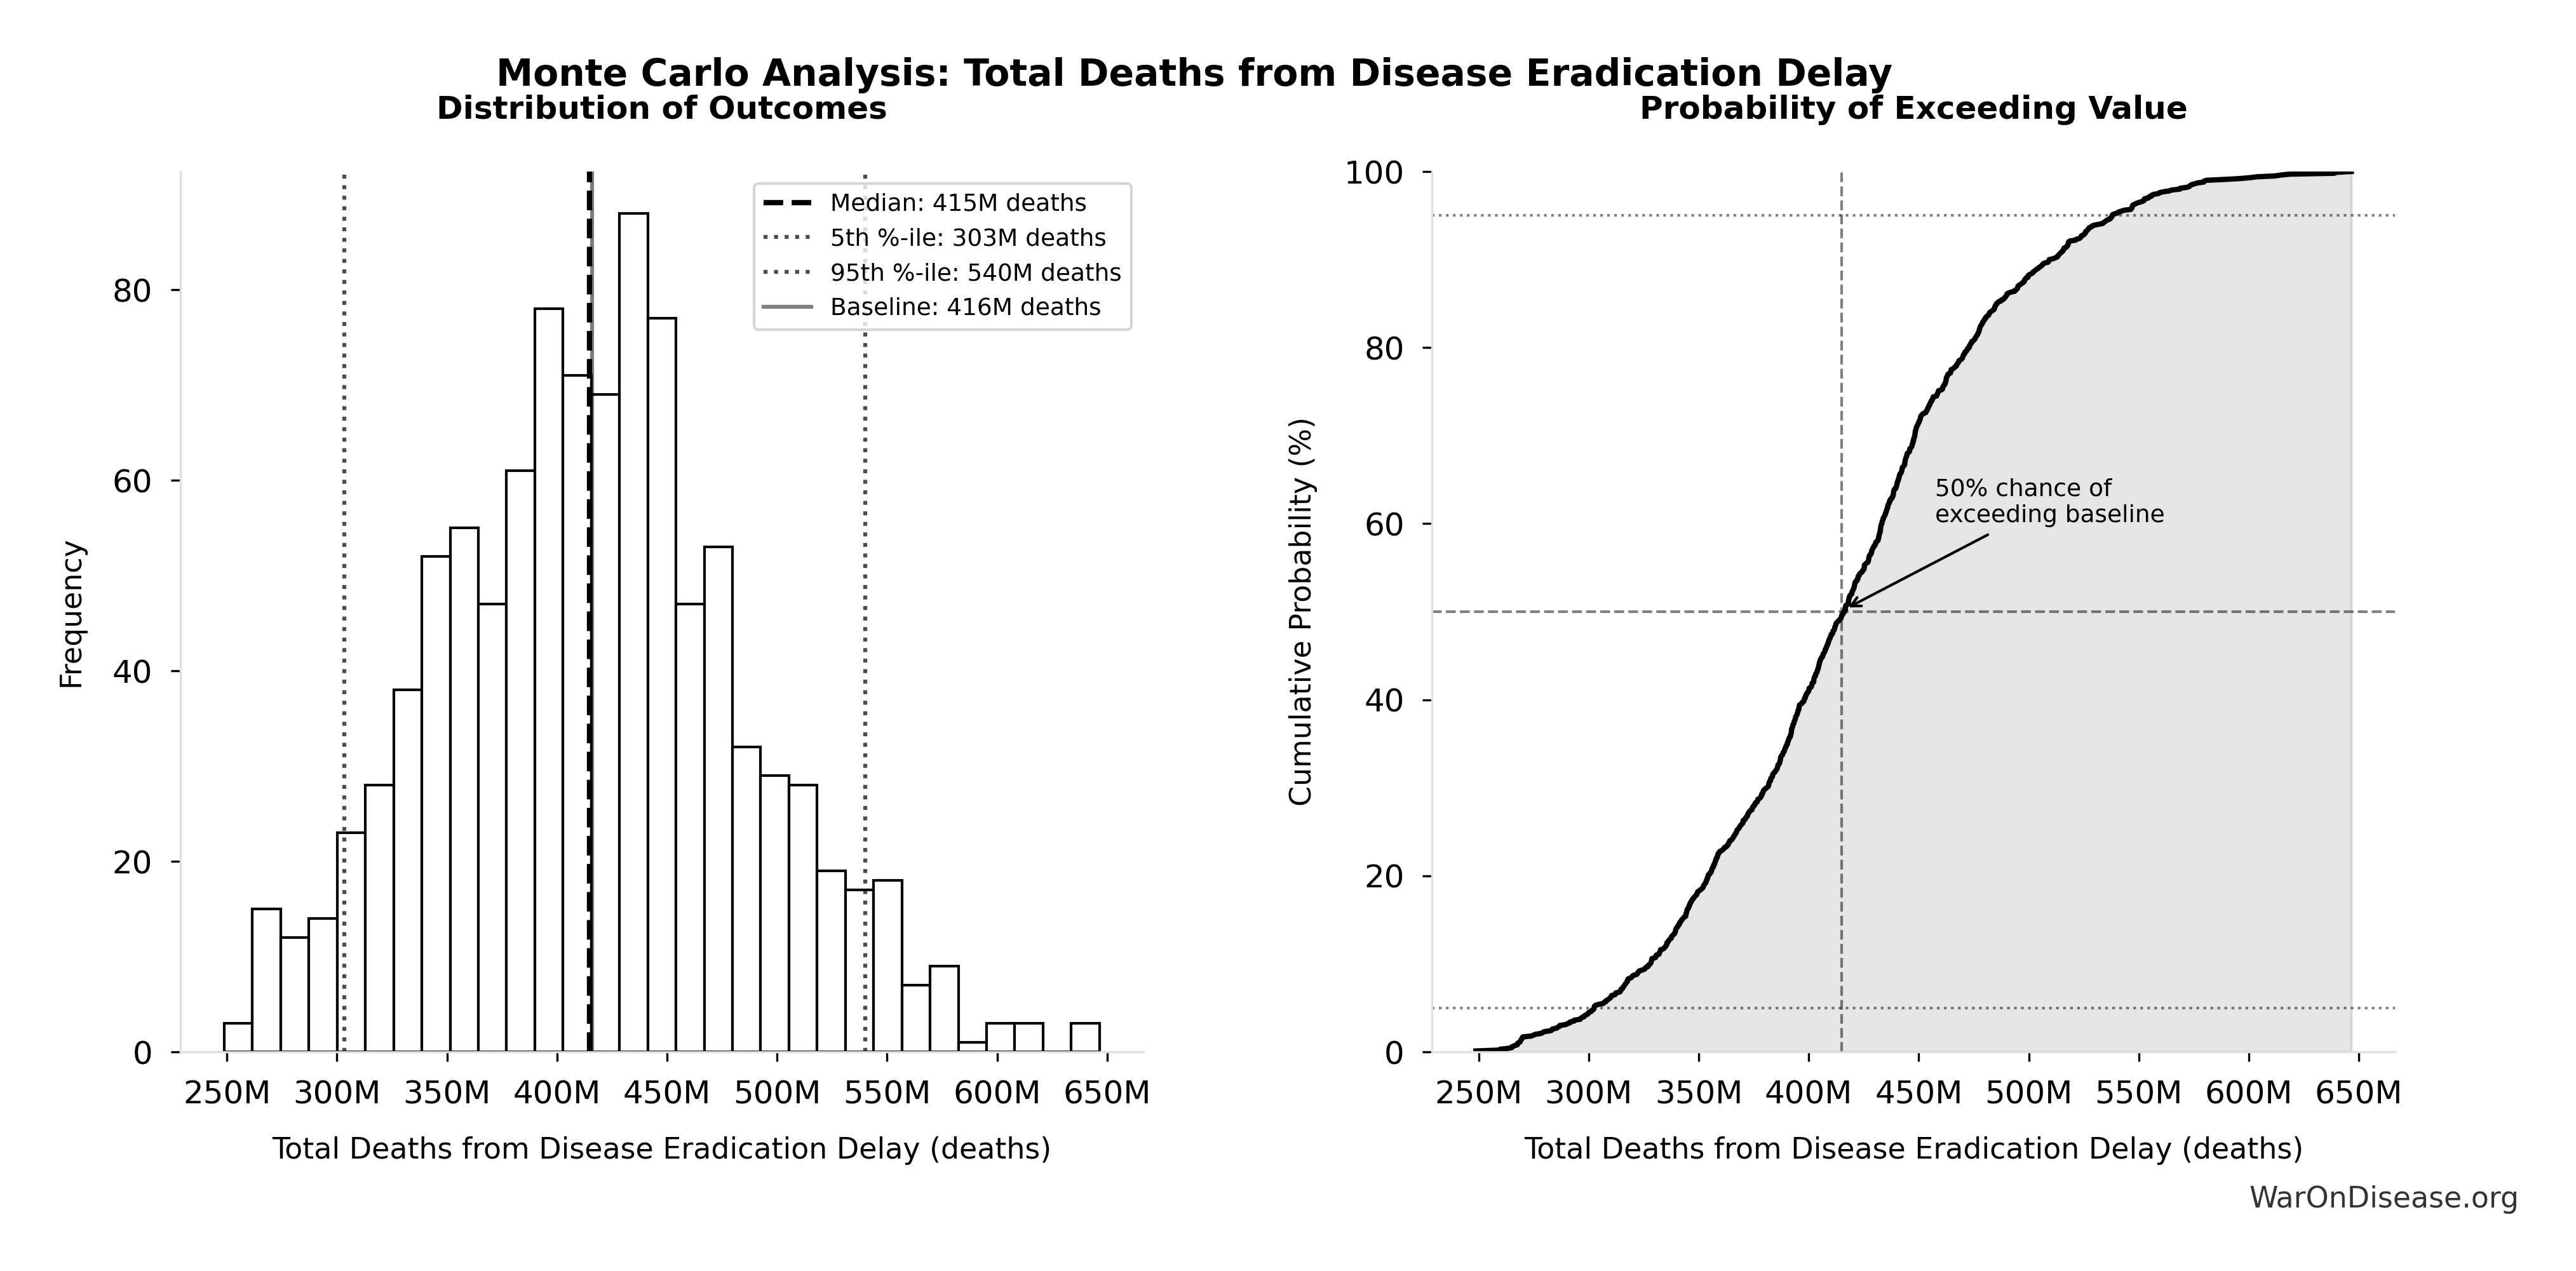
Simulation Results Summary: Total Deaths from Disease Eradication Delay
| Statistic | Value |
|---|---|
| Baseline (deterministic) | 416M |
| Mean (expected value) | 418M |
| Median (50th percentile) | 415M |
| Standard Deviation | 71.2M |
| 90% Confidence Interval | [303M, 540M] |
The histogram shows the distribution of Total Deaths from Disease Eradication Delay across 10,000 Monte Carlo simulations. The CDF (right) shows the probability of the outcome exceeding any given value, which is useful for risk assessment.
NoteWhy “Eventually Avoidable” Matters
Of 150k daily deaths:
- 92.6% eventually avoidable with sufficient biomedical research (gene therapy, AI drug discovery, cellular reprogramming, etc.)
- 7.37% fundamentally unavoidable (primarily accidents, even with advanced prevention)
This distinction maintains intellectual honesty while acknowledging that most disease deaths are preventable with advanced biotechnology. The calculation accounts for maximum achievable cure rates by disease category based on research acceleration potential.
Annual Savings
$114B + $41.5B saved per year.
These aren’t projections. They’re measurements:
- Oxford RECOVERY proved trials cost 82× less by using existing hospital infrastructure instead of dedicated trial sites
- This single trial enrolled 47,000+ patients across nearly 200 hospitals, found dexamethasone (reducing deaths by one-third in ventilated patients), ruled out hydroxychloroquine, and identified effective treatments faster than traditional regulatory processes
- The bottleneck isn’t scientific knowledge
- The bottleneck is requiring dedicated trial infrastructure when hospitals already exist
Medical progress currently flows through a coffee stirrer. This makes it a fire hose.
Why 1% Is Enough
1. The Peace Dividend
$114B/year
Bombs are expensive. Breaking things costs money. Repairing broken things costs more money. A 1% reduction in weapons procurement saves $114B annually. That’s roughly the GDP of Austria, just sitting there in the “please don’t explode us” budget.
2. The Research Efficiency Dividend
$41.5B–$83B Research & Markets (2024)
Traditional trials require:
- Dedicated trial sites with custom infrastructure (RECOVERY used existing hospitals)
- Extensive source data verification and monitoring visits (RECOVERY used routine medical records)
- Complex eligibility criteria excluding most patients (RECOVERY enrolled any hospitalized COVID patient)
- Detailed case report forms capturing hundreds of data points (RECOVERY collected <10 core outcomes)
- Years of site activation and regulatory approval per country (RECOVERY activated 185 sites in weeks)
Pragmatic trials skip this performance art entirely. This is why costs drop 82 M. Institute× instead of 2× or 5×.
3. 15–40 “NIH equivalents” of new research capacity
For the first time in human history, medical progress would advance faster than disease progression. Currently, diseases are winning the race. This reverses the score.
How It Increases National Security
All signatories reduce by 1% simultaneously.
What doesn’t change
- Power balances (everyone cuts equally)
- Deterrence (still plenty of weapons)
- Force ratios (relative strength identical)
- Strategic stability (same as before, just 1% less apocalyptic)
- Nuclear posture (can still end civilization 19 times instead of 20)
What improves
- Fewer deployed warheads (less probability someone launches by mistake)
- Lower accidental-launch risk (fewer deployed warheads to malfunction)
- Reduced crisis instability (everyone’s slightly less twitchy)
- Fewer weapons = fewer things that can catastrophically malfunction
The De-escalation Trajectory
The 1% Treaty isn’t just a budget cut; it’s an off-ramp from the arms race.
By successfully executing a verified, mutual reduction in military spending to fund a shared global good (curing disease), humanity establishes a proof-of-concept for cooperation.
- Confidence Building: Successfully auditing and reallocating 1% builds the trust and verification infrastructure required for larger steps.
- The Ratchet Mechanism: Once the economic benefits of the “Peace Dividend” (wealth, health, longevity) materialize, the incentive to increase the treaty percentage grows. We move from a negative-sum arms race to a positive-sum “peace race.”
- Existential Risk Reduction: Gradually increasing the percentage creates a trajectory toward phasing out large-scale conflict entirely. Since a primary driver of existential risk is autonomous murder-maximizing AI produced by military arms races, de-escalating this race via the treaty is arguably the single most effective X-Risk strategy available.
This gradual approach steers nations toward a safer equilibrium, one percentage point at a time.
Why The Ratchet Works: The IAB Scaling Engine
The ratchet mechanism isn’t just economic gravity. It’s engineered through Incentive Alignment Bonds.
The key insight: 10% of treaty revenue funds political incentives. This amount scales with treaty size:
| Treaty Level | Total Revenue | IAB Political Funding | Pragmatic Trial Funding |
|---|---|---|---|
| 1% | $27.2B |
$2.72B/year | $21.7B/year |
| 2% | $54B | $5.4B/year | $43.2B/year |
| 5% | $135B | $13.5B/year | $108B/year |
| 10% | $270B | $27B/year | $216B/year |
| 50% | $1.35T | $135B/year | $1.08T/year |
| 100% | $2.7T | $270B/year | $2.16T/year |
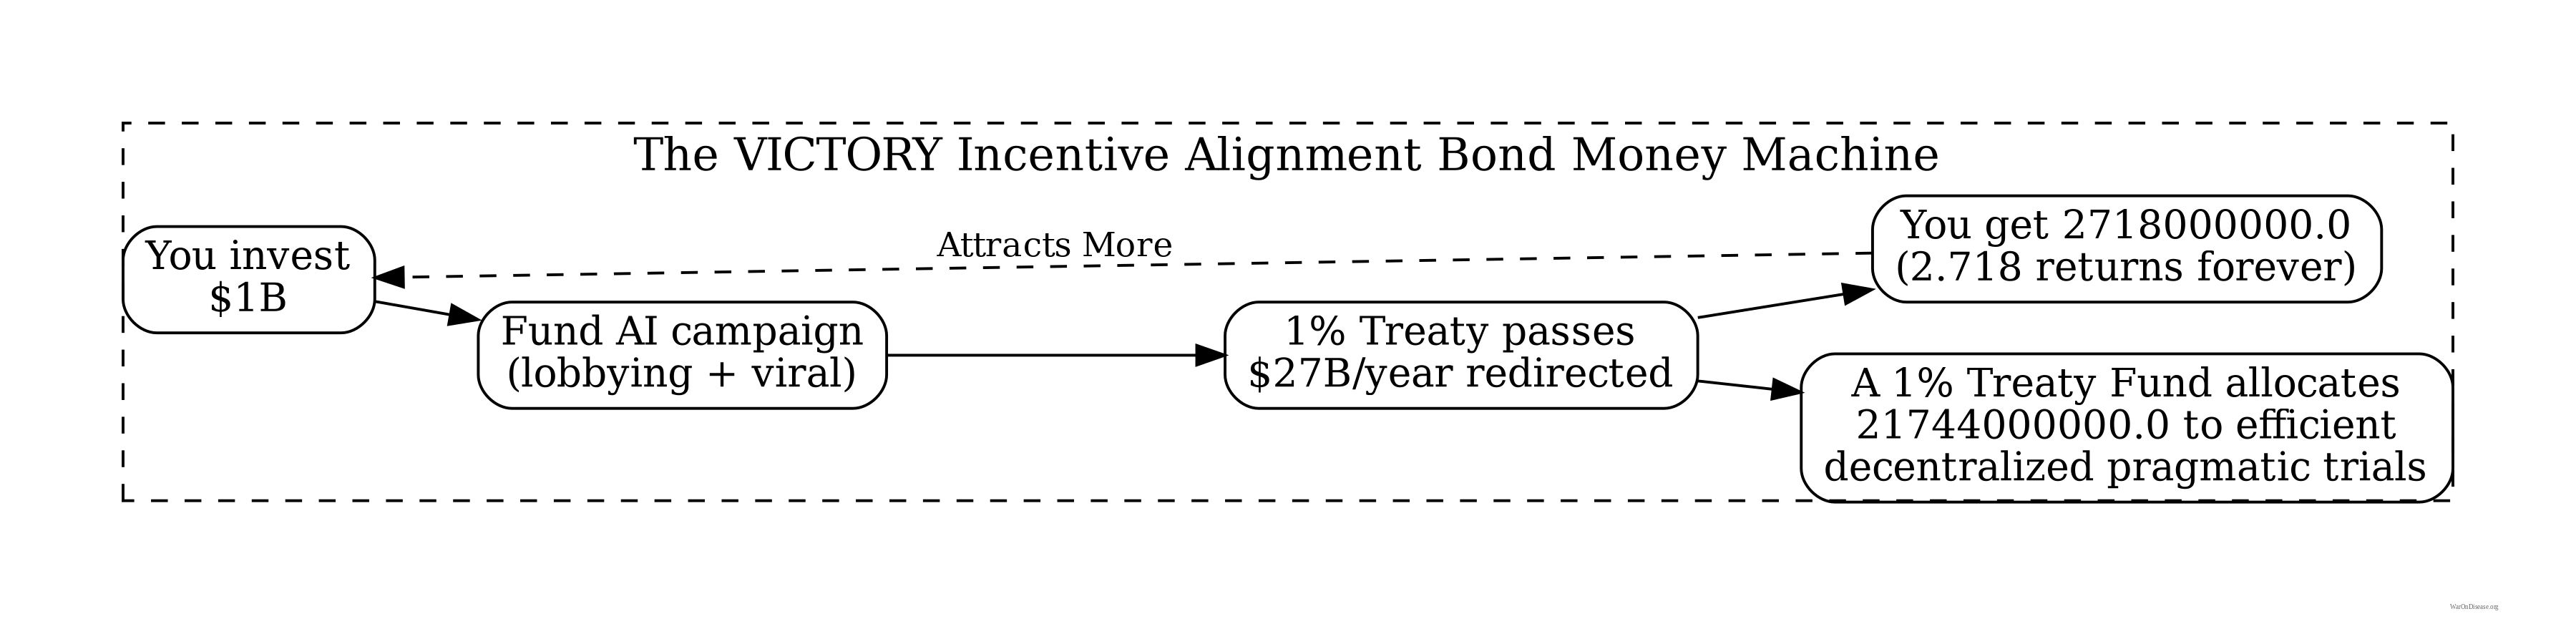
VICTORY Incentive Alignment Bond investors are satisfied at 1%. They receive 272% returns regardless of treaty expansion.
Politicians, however, see their rewards grow with each expansion. This creates sustained pressure to increase treaty percentages. By the time redirection reaches 50%, the political incentive pool ($135B/year) exceeds all current global lobbying combined.
The 80/10/10 allocation structure functions as a political transformation engine, making the transition from military spending to health investment economically self-reinforcing.
Political Economy and Financing
Ideas don’t win on merit alone. They win by aligning incentives.
This section describes how Incentive Alignment Bonds (IABs) restructure the political economy of global health funding.
Incentive Alignment Bonds
Incentive Alignment Bonds address a fundamental problem: politicians face career penalties for supporting beneficial policies that threaten incumbent industries. IABs restructure these incentives so that supporting effective policy becomes professionally advantageous.
The mechanism applies public choice theory systematically. Rather than requiring altruism, it makes self-interest align with social welfare. Politicians pursuing their own career advancement simultaneously advance global health outcomes.
Mechanism Architecture
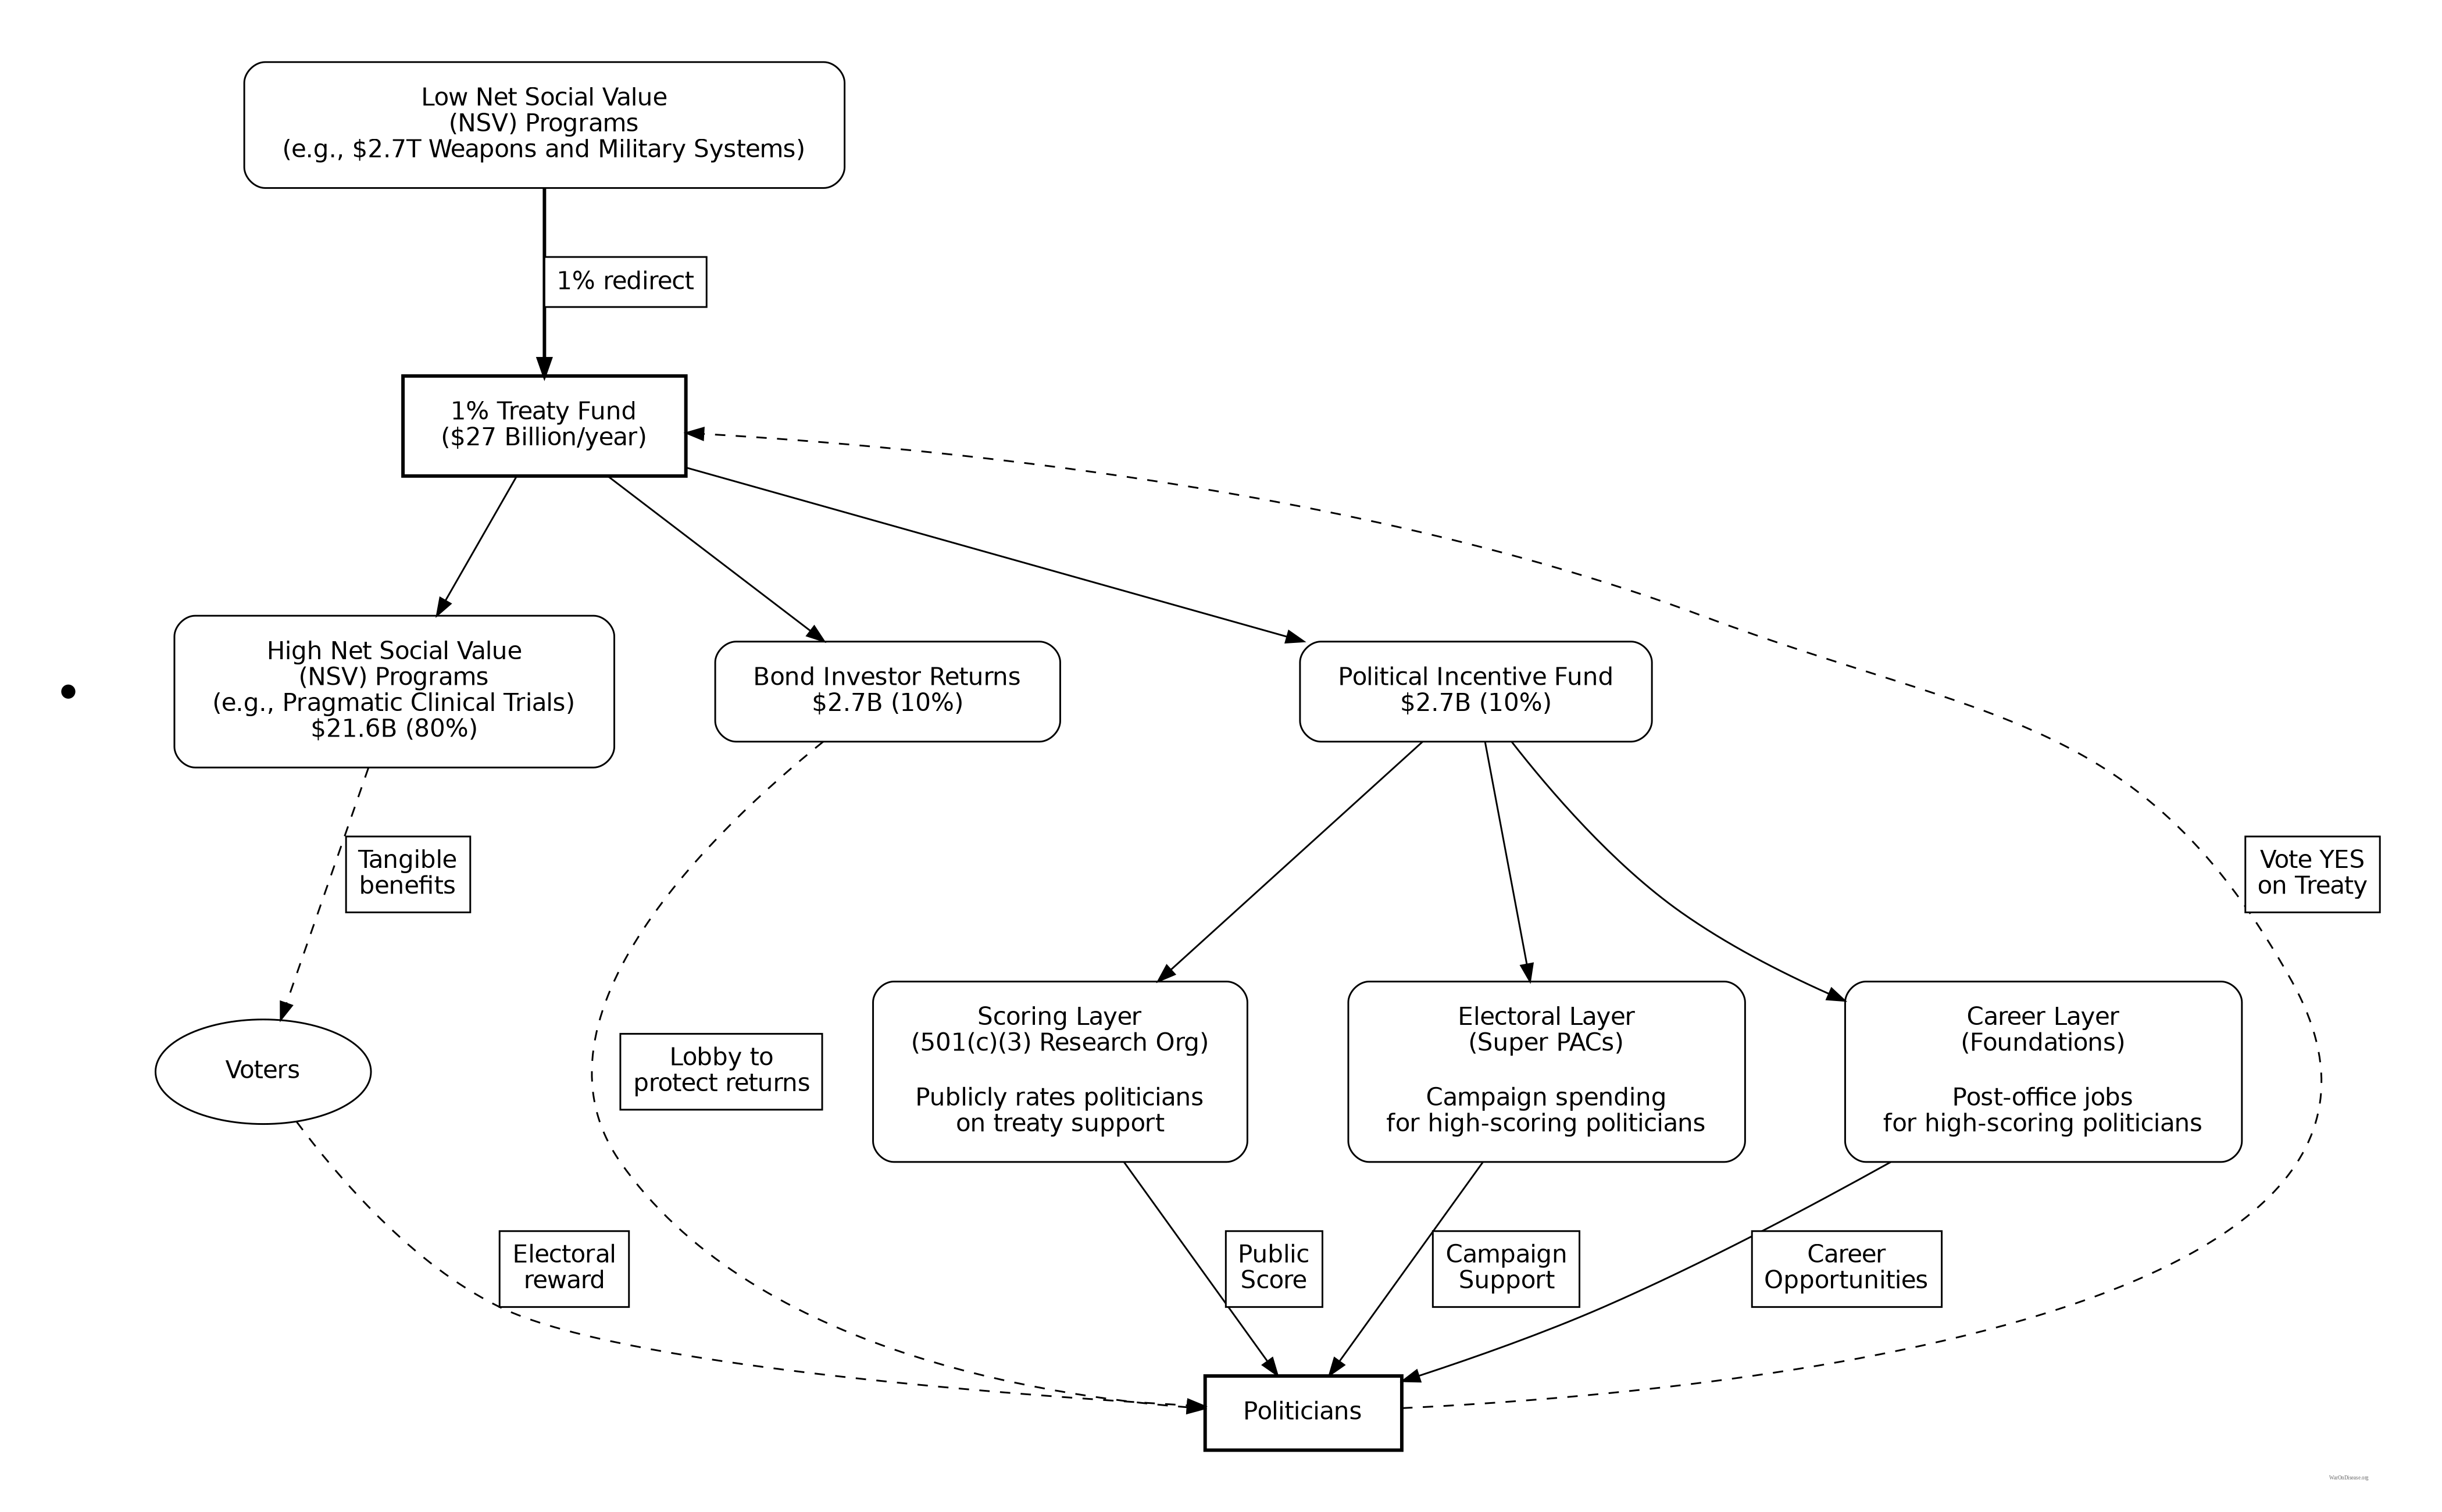
Politicians are evaluated through a Public Good Score based on verifiable voting records for treaty funding. This scoring system creates three channels of incentive alignment:
- Electoral advantage: Independent campaign support flows to high-scoring politicians
- Reputational benefits: Public scores create transparency and accountability
- Post-office opportunities: High scorers gain access to prestigious fellowships, advisory positions, and speaking engagements
Critically, no direct monetary transfers to politicians occur. Benefits flow through reputation, electoral support, and career advancement - all based on publicly verifiable voting records that cannot be manipulated.
Comparative Static Analysis: Senator Smith
Consider a legislator’s decision calculus regarding the 1% Treaty vote:
Without IABs:
| Action | Expected Outcome |
|---|---|
| Vote Yes | Defense lobby attack ads; reduced industry support |
| Vote No | Retained defense contractor funding; no electoral risk |
With IABs:
| Action | Expected Outcome |
|---|---|
| Vote Yes | Public Good Score: 45 → 72; P(reelection): 55% → 62%; Expected post-office income: $200K → $500K/yr |
| Vote No | Score: 45 → 30; P(reelection): 55% → 48%; Opposition receives $2M independent support |
The mechanism changes the math. Supporting beneficial policy becomes professionally advantageous rather than requiring self-sacrifice.
Stakeholder Alignment
The IAB mechanism aligns incentives across all key stakeholder groups:
Defense Contractors: Retain 99% of current budgets while earning 272% returns on VICTORY Incentive Alignment Bonds. The treaty creates new revenue streams without threatening core business.
Insurance Companies: Healthier populations generate higher lifetime premium revenue. Patients living longer with better health outcomes produce better actuarial performance than the current mortality-driven model.
Pharmaceutical Companies: Trial costs convert to revenue streams. Instead of paying $48K P. Research per trial patient, companies collect $500 Oren Cass (2023) subsidies when patients enroll. This transforms trials from cost centers to profit centers.
Politicians: 280M million voters represent a significant electoral constituency. Politicians supporting the treaty gain reputation benefits, campaign support, and reduced opposition funding. Those opposing it face well-funded challengers and organized voter blocs.
Investors: VICTORY Incentive Alignment Bonds offer 272% annual returns, substantially exceeding typical market returns of 10%.
Patients: Subsidized access to experimental treatments recommended by physicians. Patients choose which trials to join, with subsidies following their decisions. Additional benefits include lifetime wealth gains and longevity increases from the economic multiplier effect.
The mechanism redirects competitive incentives from zero-sum conflicts toward positive-sum health outcomes.
See Aligning Incentives for complete analysis.
VICTORY Incentive Alignment Bonds
VICTORY Incentive Alignment Bonds implement this architecture specifically for the 1% treaty, aligning multiple stakeholder groups:
| Stakeholder | Return Mechanism | Funding Source |
|---|---|---|
| Investors | 272% annual returns | 10% of treaty revenue |
| Politicians | Reputation, electoral support, career advancement | 10% of treaty revenue |
| Patients | Subsidized trial access, accelerated treatments | 80% of treaty revenue |
Investors provide upfront campaign capital ($1B). Politicians gain career benefits for treaty support. Patients receive medical benefits. Each stakeholder’s self-interest points toward treaty passage and expansion.
Legal and Ethical Framework
This mechanism differs from bribery in four key ways:
- No duty violation: IABs reward policy support that advances rather than undermines public welfare
- Transparent rules: Scoring criteria are public, announced in advance, and apply equally to all legislators
- No direct payments: Benefits flow through reputation, electoral support, and career opportunities, not cash transfers
- Verifiable metrics: Scores depend entirely on public voting records from official government sources
The mechanism strengthens rather than corrupts the alignment between political success and social outcomes.
Generalized Governance Application
While designed for the 1% Treaty, the IAB architecture applies to any global coordination problem requiring sustained political commitment. Climate change mitigation, nuclear disarmament, and pandemic preparedness all face the same challenge: aligning short-term political incentives with long-term collective welfare. The IAB mechanism provides a systematic solution.
Dominance Analysis
For objectives including:
- Years humans spend alive and healthy (QALYs)
- Lifespan
- Productivity
- Economic growth
- National security
- Existential safety
- Not suffering unnecessarily
Redirection of 1% of military spending to pragmatic trials is the mathematically dominant strategy.
Quantitative Comparison
If you have $1B to allocate toward saving lives, here’s what each option delivers:
| Intervention | Cost per DALY | Scale | Economic Model |
|---|---|---|---|
| 1% Treaty (Timeline Shift) | Cost-dominant (generates profit) | ||
| 1% Treaty (Expected Value) | At 1% success probability | 7.07× better than bed nets | |
| Malaria Bed Nets | Proven, scalable | Linear scaling | |
| Childhood Vaccinations | Self-funding | Annual benefit: ~$15B | Self-funding |
| GiveWell Top Charities | $3.50K-$5.50K per life saved | Variable | Linear scaling |
| Cancer Screening | $20,000-$50,000 | Variable | Linear scaling |
| Cardiovascular Prevention | $10,000-$30,000 | Variable | Linear scaling |

Why This Dominates
Not bed nets (excellent). Not research grants (helpful). Not climate interventions (necessary). Not economic reforms (worthwhile). Not AI safety (urgent). Not other treaties (good luck).
All valuable. All recommended. None offer 22.8× leverage.
The critical distinction: most interventions are linear (2× impact requires 2× money). This intervention is systemic (unlocks exponential research acceleration by removing cost barriers that currently make 99.6% of potential drug-disease combinations economically infeasible to test).
Methodology
This analysis uses three standard health economics tools:
- Net Present Value (NPV): Future money is worth less than current money because humans are impatient
- Quality-Adjusted Life Years (QALYs): Measuring healthy life, not just survival - a year lived in full health scores 1.0, while years with illness or disability score proportionally lower
- Return on Investment (ROI): Economic value generated per dollar invested
The methodology follows standard health economics practices. All parameters, sources, and uncertainty ranges are documented in Parameters and Calculations.
Cost-Benefit Framework
Cost Components
You spend $1B convincing humans that not dying is preferable to dying. This covers:
- Global referendum campaign to get 280M votes ($300M)
- Professional lobbyists, previously employed by defense contractors, now employed by pharmaceutical companies ($650M)
- Super PAC papers that make politicians care about living voters ($800M)
This is a one-time cost. You either achieve treaty passage or you don’t.
Benefit Components
The treaty redirects $27.2B annually from military spending to pragmatic clinical trials. This money already exists. You’re not printing new money or raising taxes. You’re just moving existing money from weapons procurement to clinical trials.
This generates benefits through two mechanisms:
1. You stop setting money on fire
Military spending has economic multiplier effects of 0.6 Mercatus. That means for every dollar spent on bombs, you get 50 cents to a dollar of economic value. Medical research has multiplier effects of 4.3 PMC (2022). For every dollar spent curing diseases, you get $2-3 of economic value.
2. You stop paying people to make trials cost 82 times too much
Traditional FDA Phase 3 trials cost $41K NCBI per patient due to site setup costs, dedicated research staff, patient travel reimbursement, custom case report forms, and extensive monitoring requirements. The Oxford RECOVERY trial cost $500 Oren Cass (2023) per patient by using existing hospital infrastructure, minimal additional data collection beyond standard care, and simplified consent processes.
That’s an 82x M. Institute cost reduction from eliminating unnecessary overhead and using existing infrastructure.
The distribution below shows the uncertainty range for the cost reduction factor based on empirical data from RECOVERY and similar pragmatic trials:
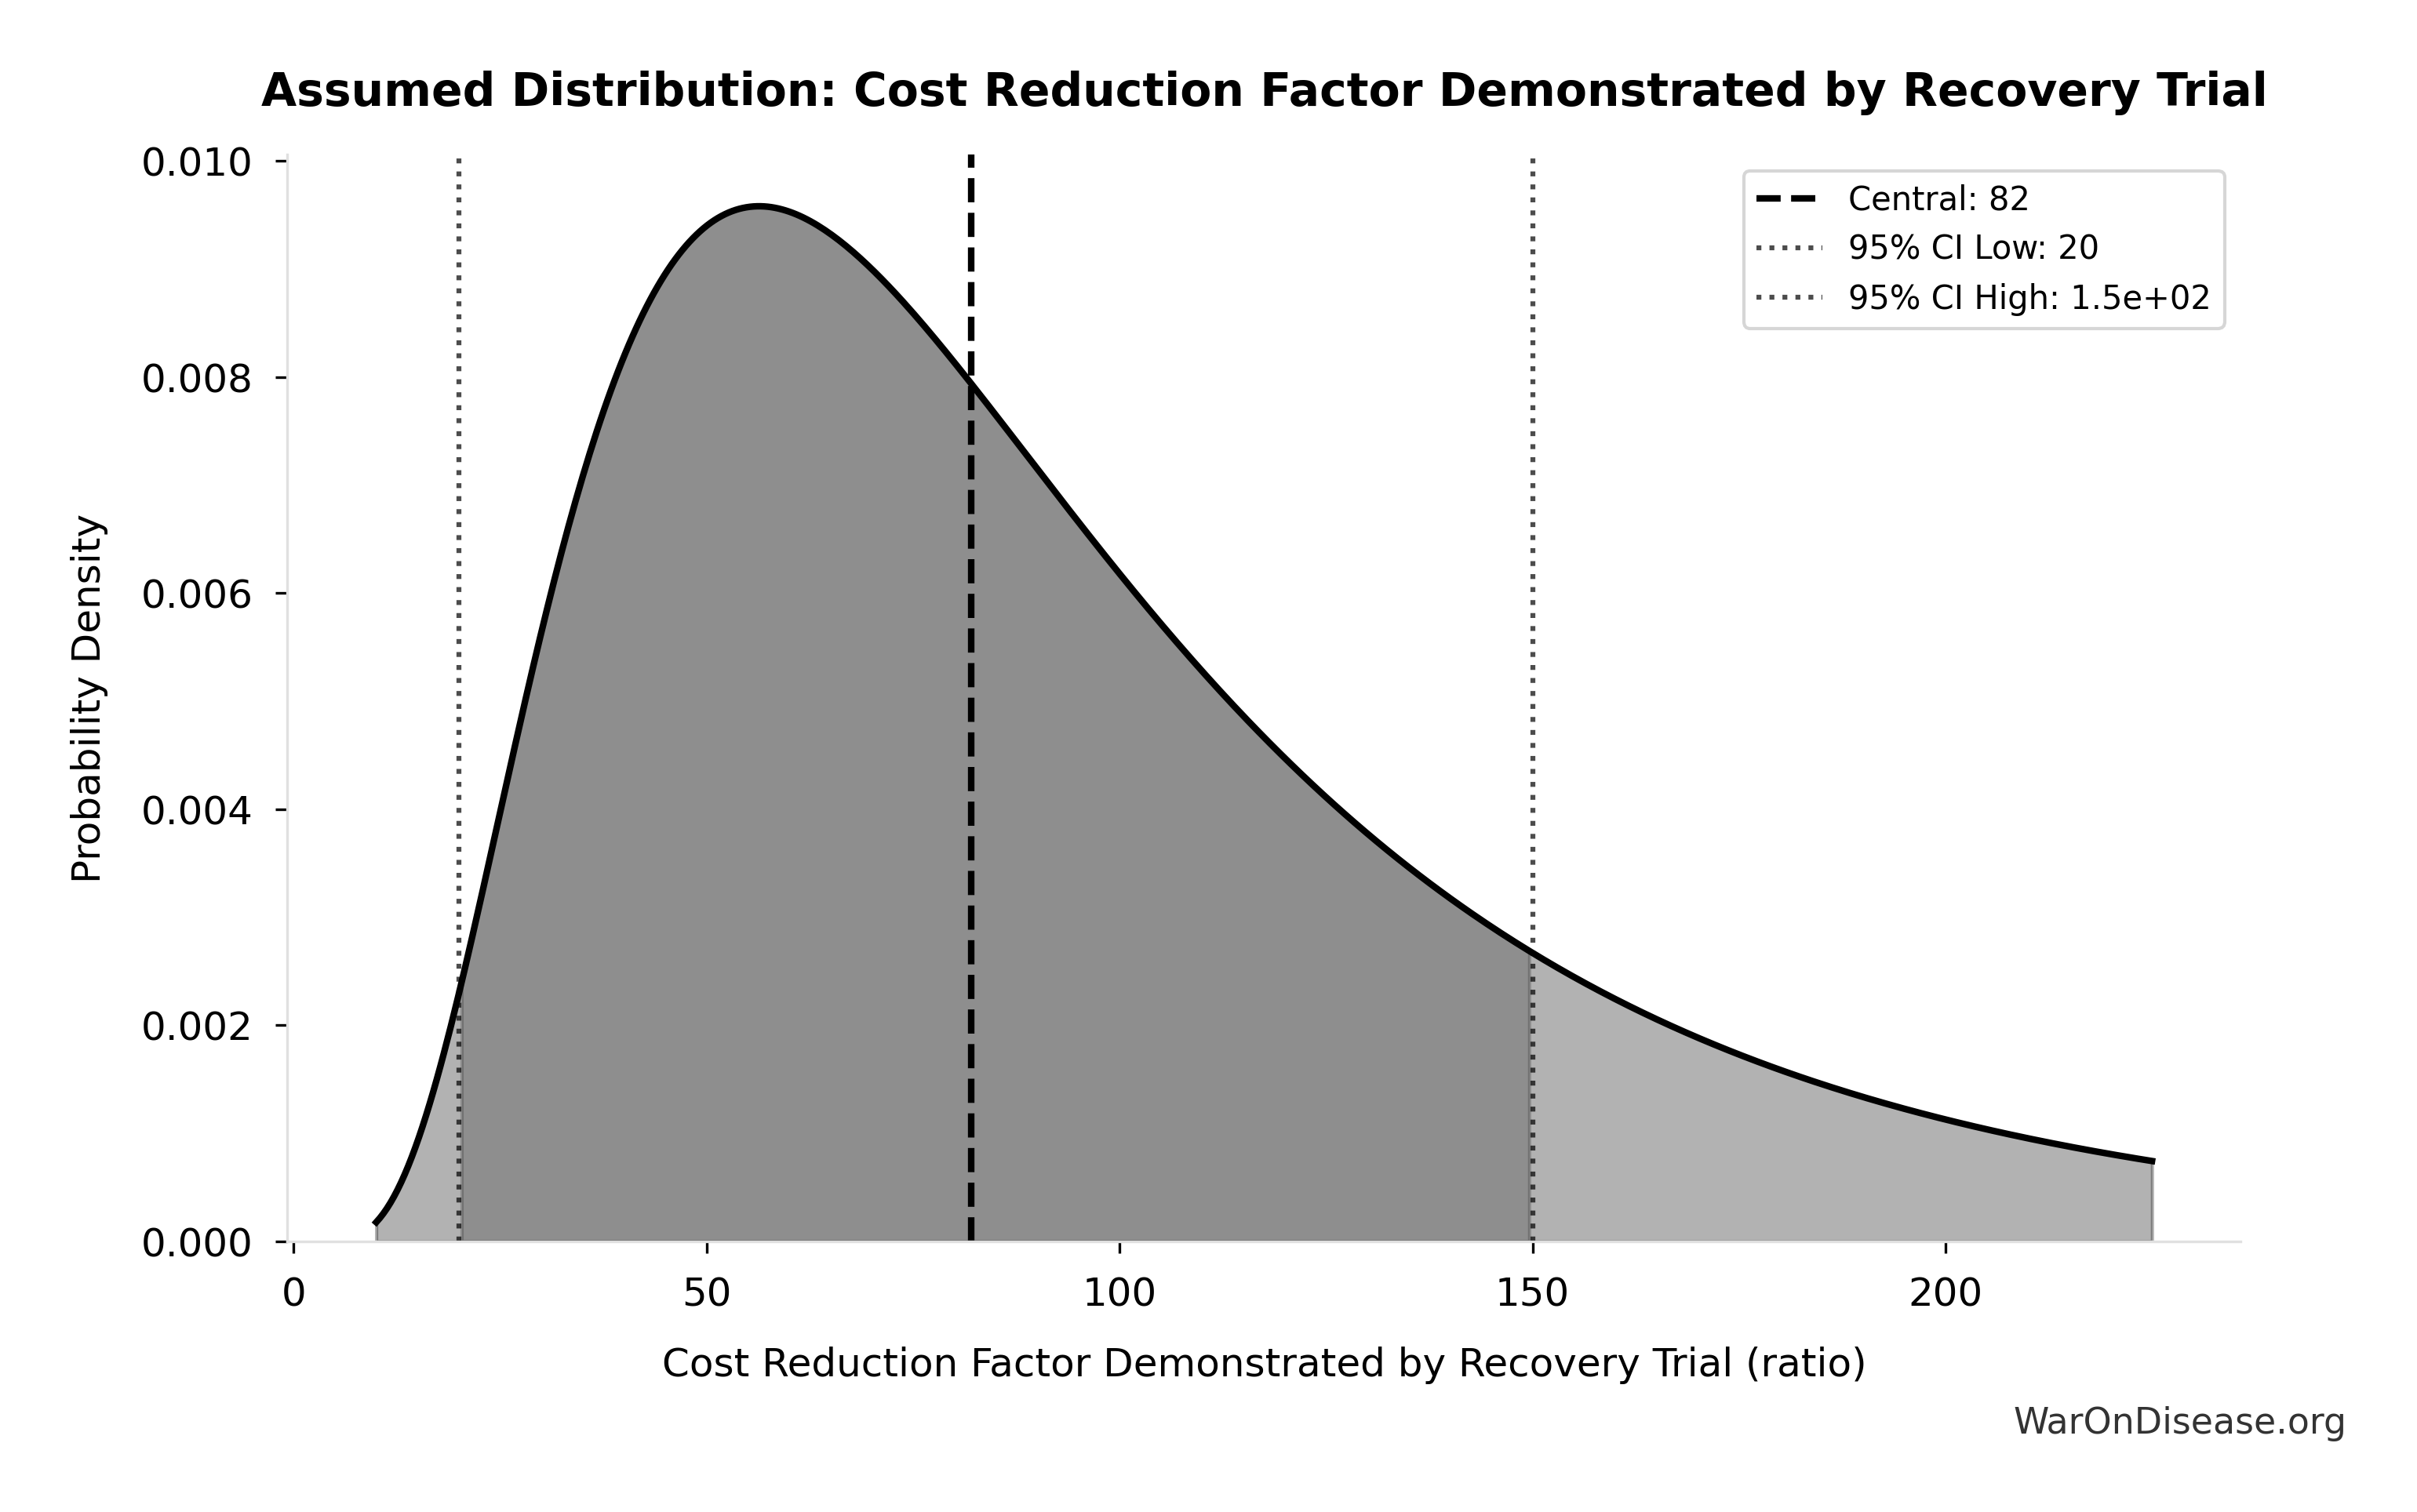
This chart shows the assumed probability distribution for this parameter. The shaded region represents the 95% confidence interval where we expect the true value to fall.
ROI Calculation
\[ ROI_{RD} = \frac{\$249.3B}{\$0.54B} \approx 463 \]
In human language: “How much value do you get per dollar spent?”
Conservative scenario (only counting R&D efficiency, ignoring everything else):
\[ ROI_{RD} = \frac{\$249.3B}{\$0.54B} \approx 463 \]
You spend $1, you get $451 back. This beats most legal activities.
Complete scenario (PRIMARY estimate including all core benefits):
\[ ROI_{lag\_elimination} = \frac{\$1{,}286T}{\$1.00B} = 1{,}286{,}242:1 \]
You spend $1 billion once, you get $1.19M billion back every year in recurring benefits.
Cost-Effectiveness Analysis
Health economists invented a metric called ICER (Incremental Cost-Effectiveness Ratio) to measure cost-effectiveness:
ICER = (Cost) / (Health Benefit in QALYs)
Translation: “How much does it cost per year of healthy life created?”
WHO says interventions under $50K PMC per QALY are “cost-effective.” Most successful health programs cost $3,000-10,000 per QALY.
This system’s ICER: $0.126 per DALY (negative, meaning cost-dominant)
That’s negative. Negative means you MAKE money while saving lives. Economists call this a “dominant intervention” because even they can’t argue against it.
This approach doesn’t cost money to save lives. Instead, it generates profit per life saved.
Traditional charity: “Please donate $4.50K to save one life” This approach: “We saved a life as a side effect of doing profitable things”
Technical note: This uses “net present value,” which is economist code for “future money is worth less than current money” (3% discount rate). If you’re into spreadsheets: full NPV methodology here.
NoteExpected Value Under Political Uncertainty
Conditional on success: $0.126 per DALY
\[ \text{Cost/DALY} = \frac{\$1.0B}{7.90B} = \$0.127 \]
Risk-adjusted expected value: $13 per DALY
\[ E[\text{Cost/DALY}] = \frac{\text{Cost}_{conditional}}{P_{success}} \]
Uncertainty in Risk-Adjusted Cost-Effectiveness
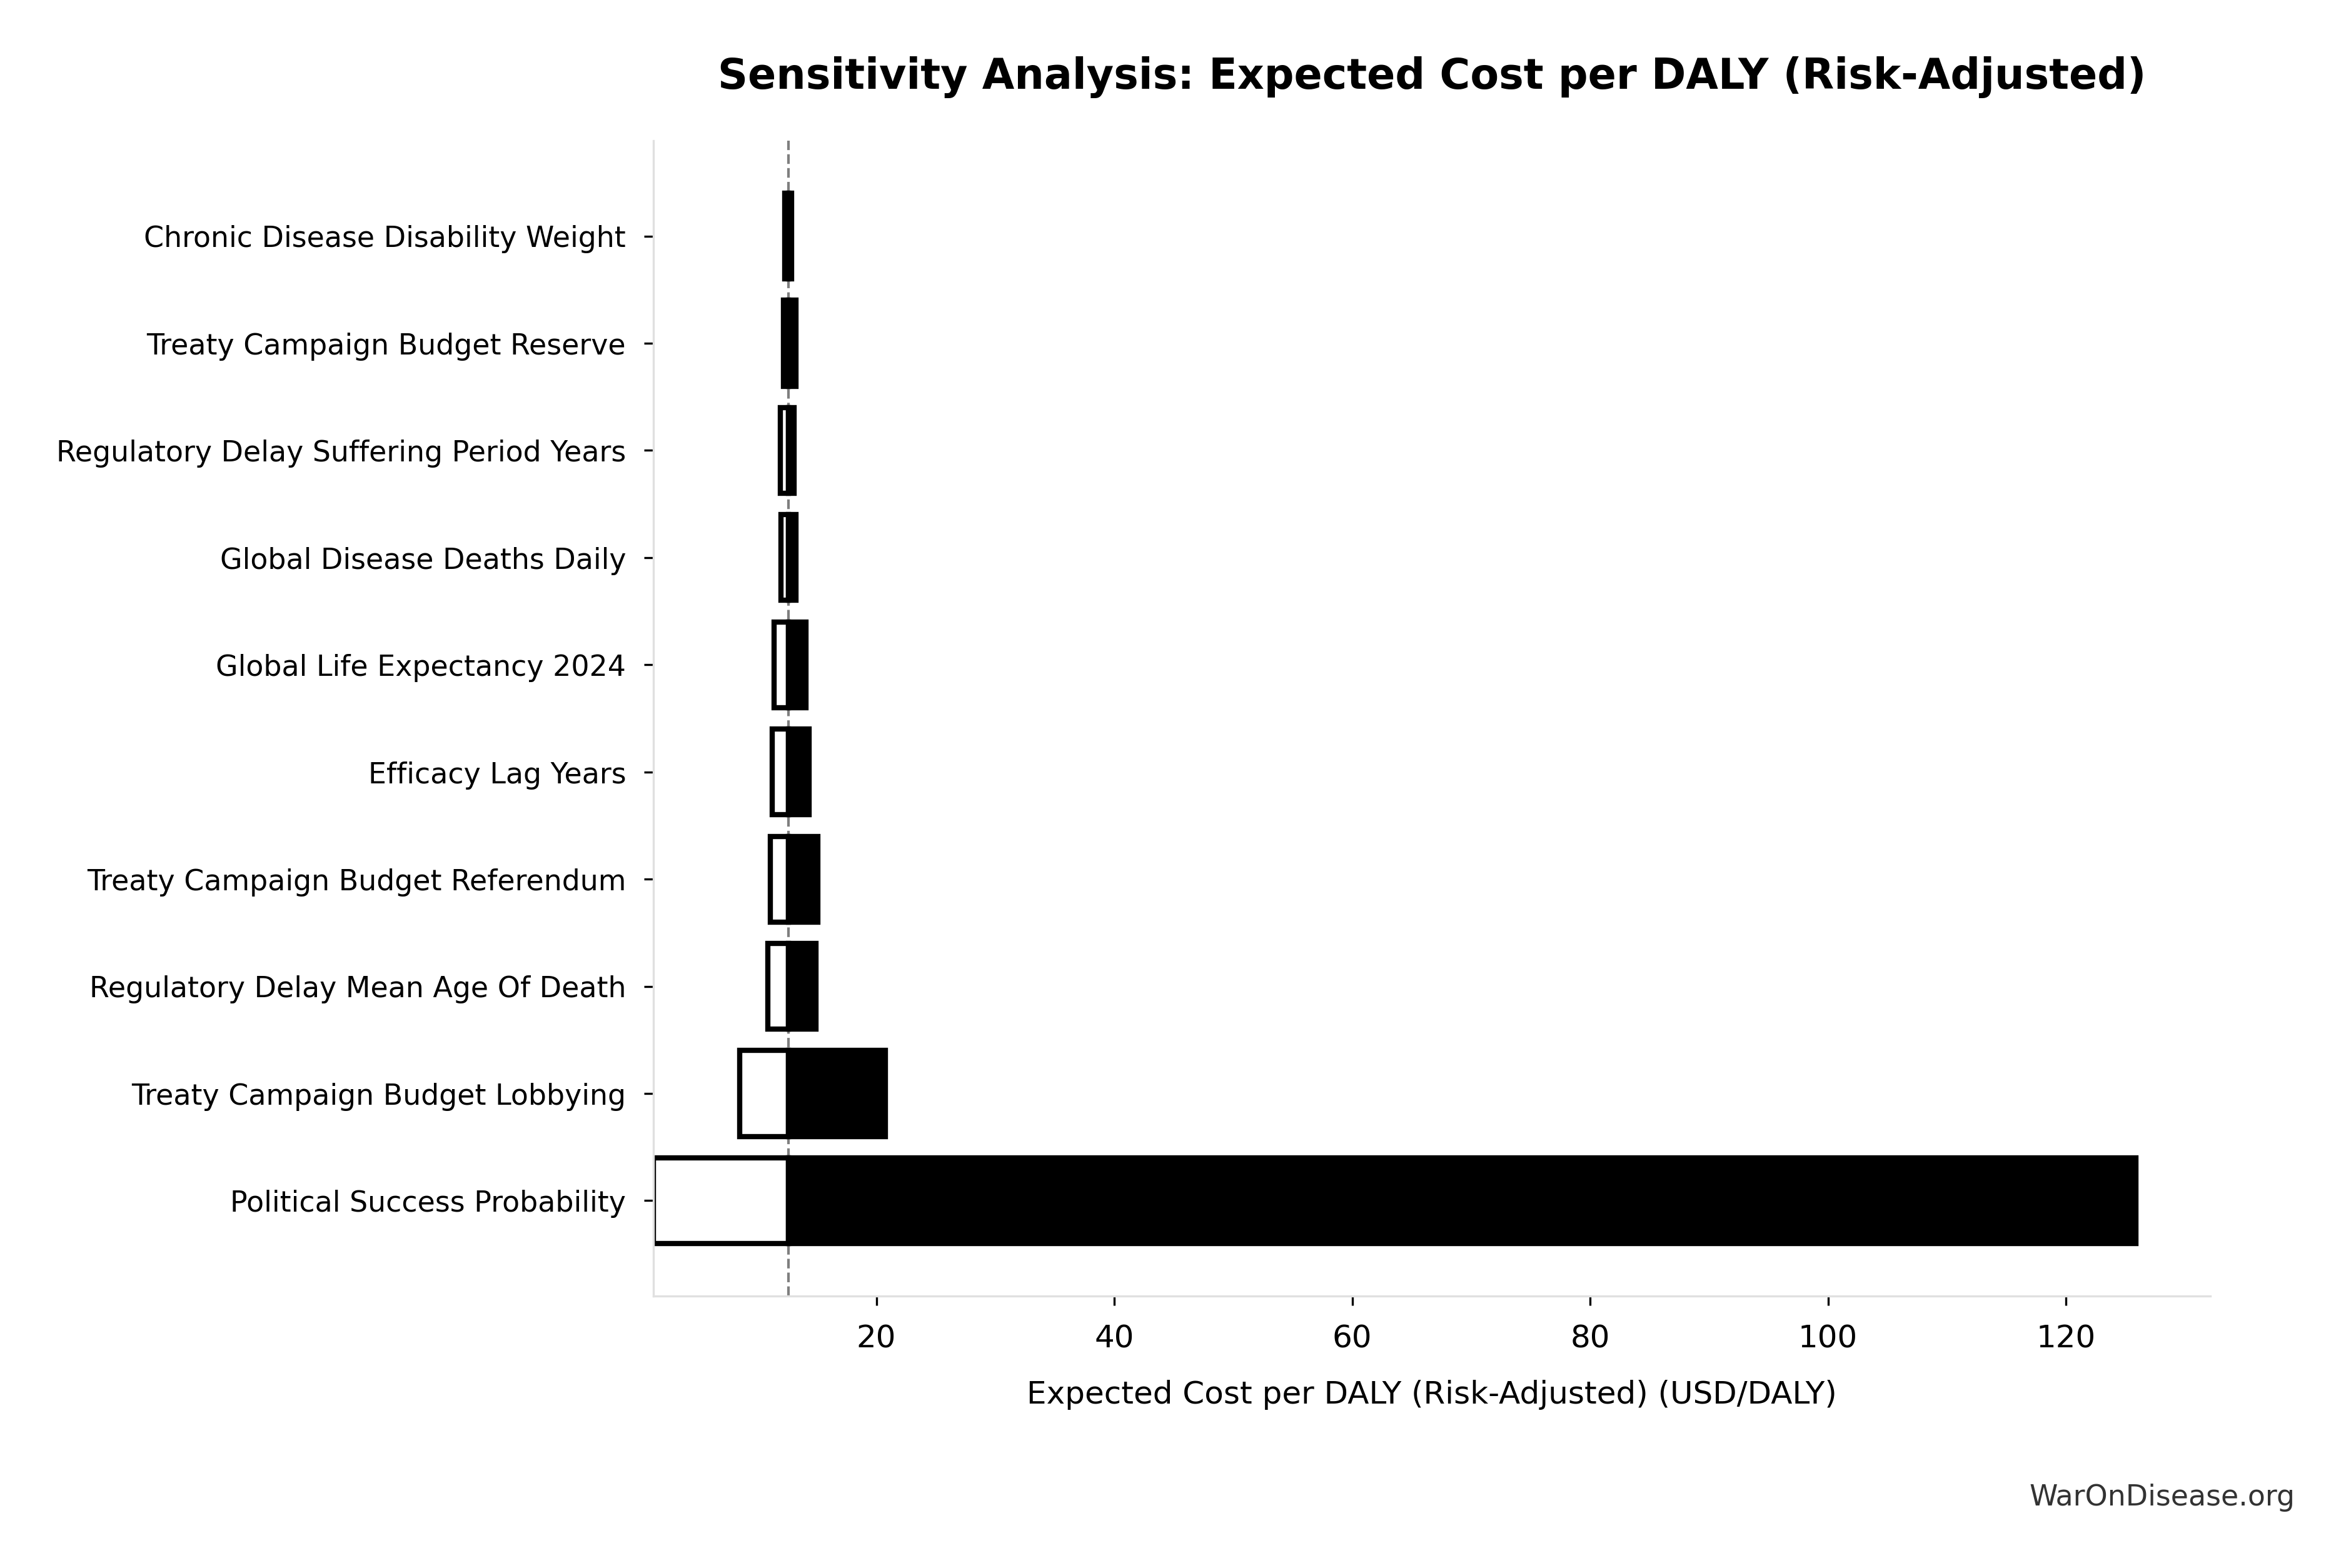
The tornado diagram shows that political success probability dominates uncertainty in risk-adjusted cost-effectiveness. Even at conservative political success estimates, expected cost per DALY remains highly competitive with top global health interventions.
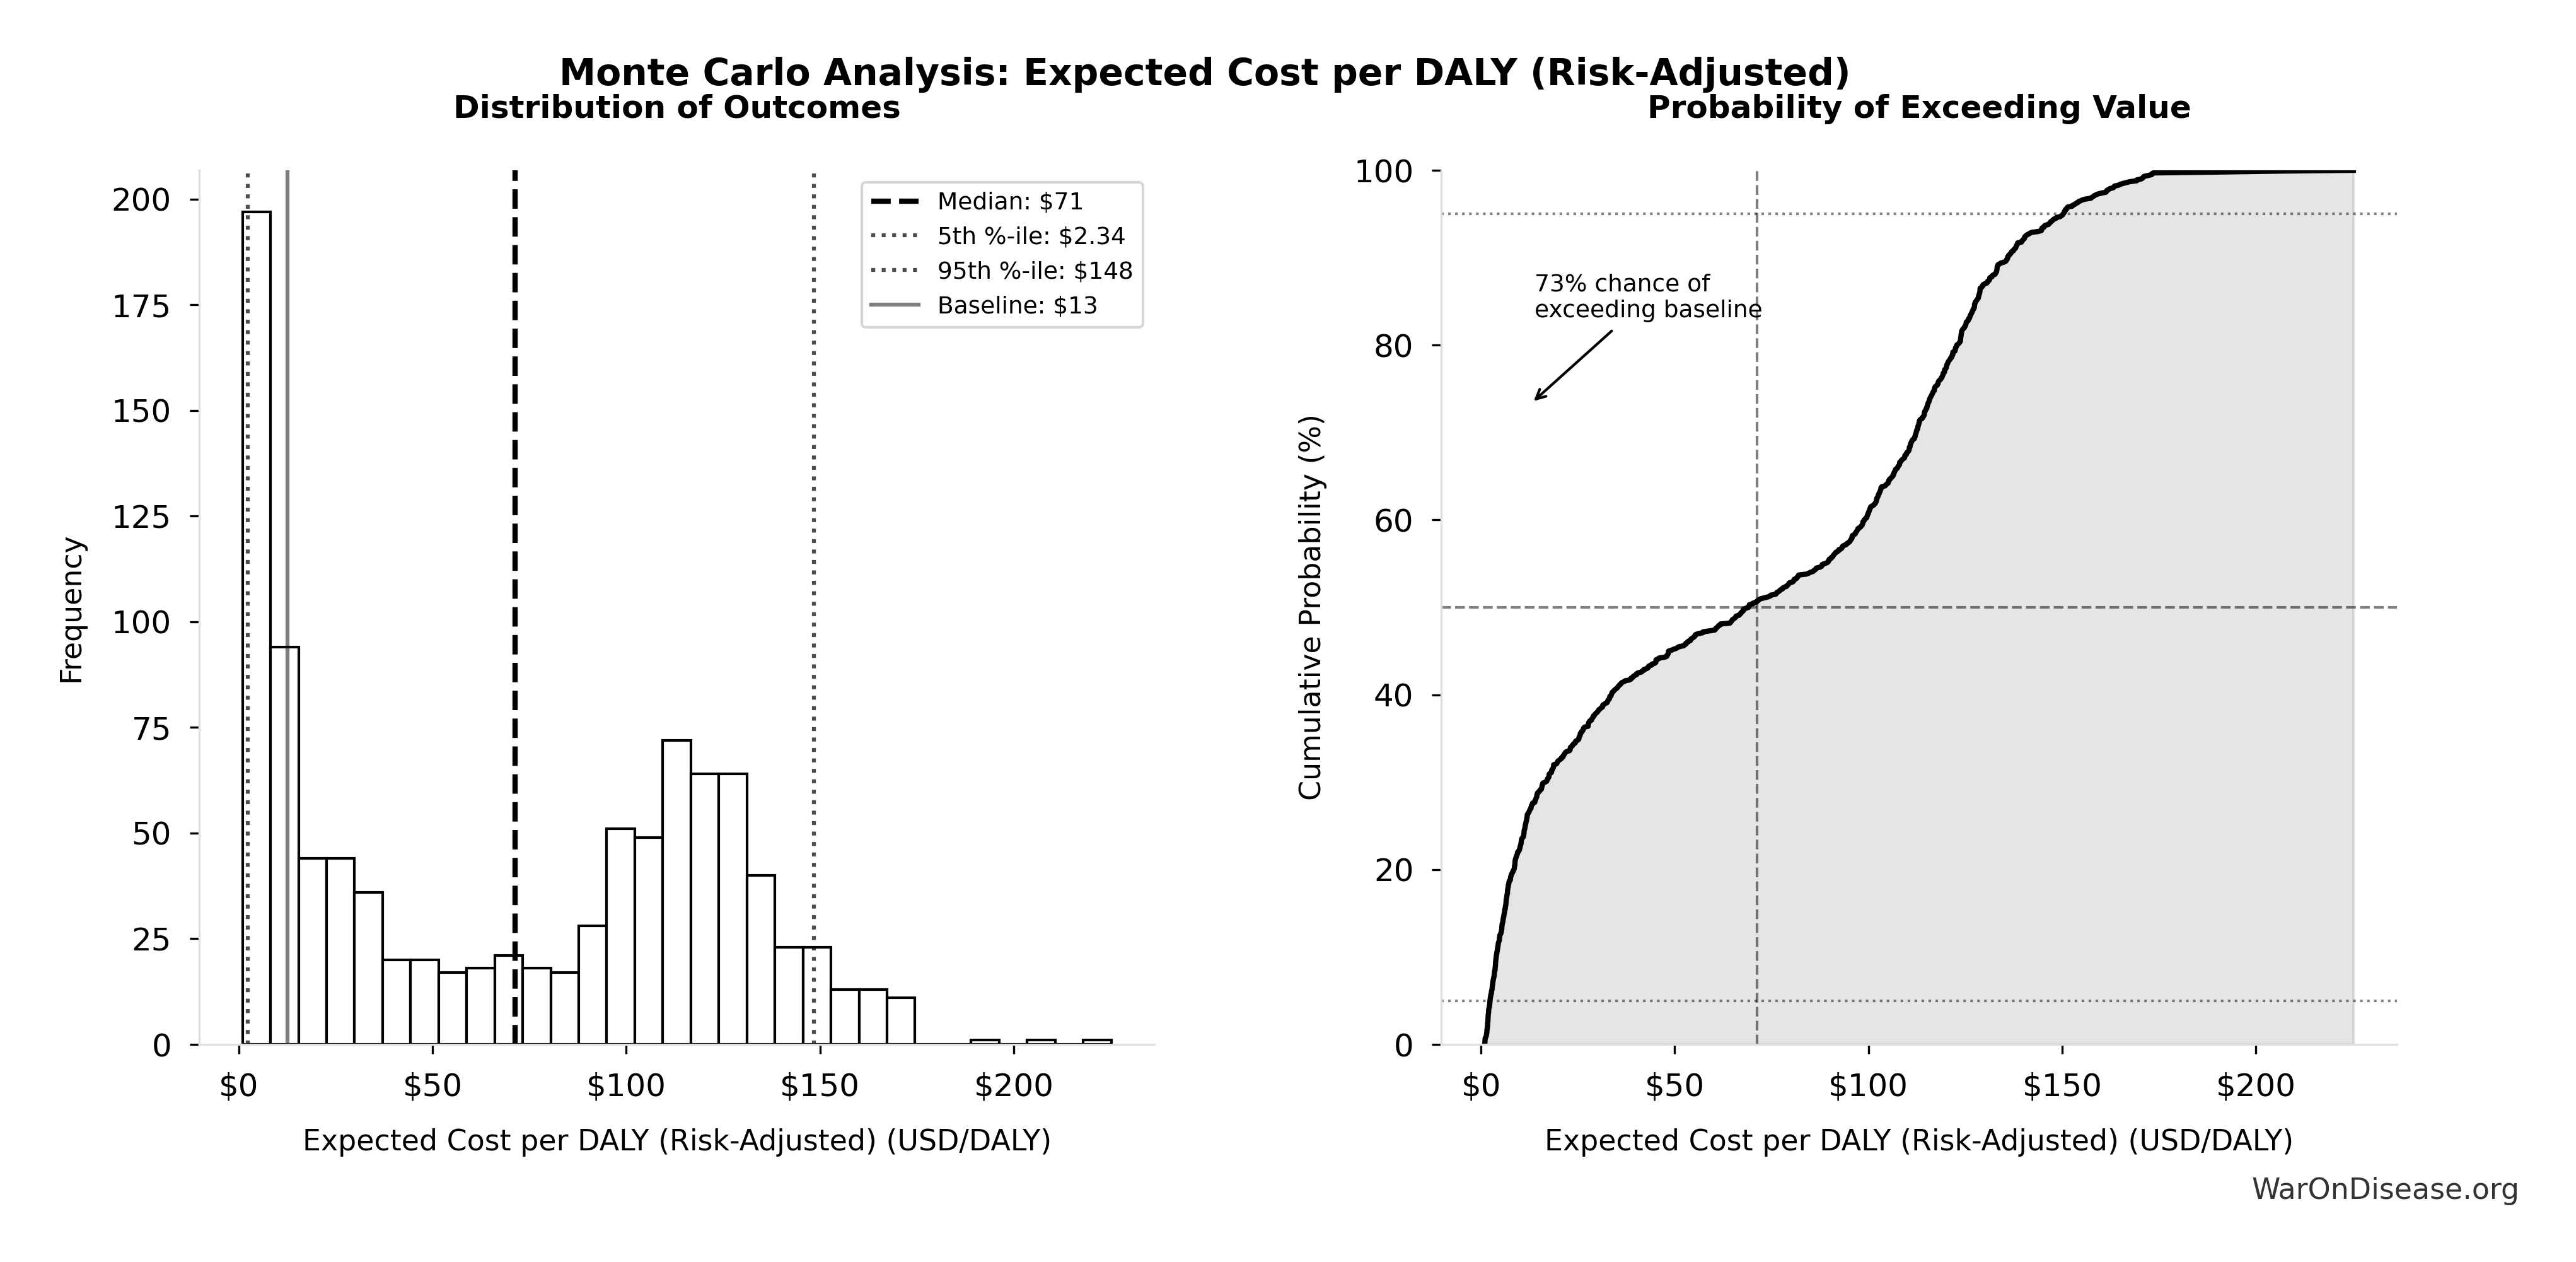
Simulation Results Summary: Expected Cost per DALY (Risk-Adjusted)
| Statistic | Value |
|---|---|
| Baseline (deterministic) | $13 |
| Mean (expected value) | $69 |
| Median (50th percentile) | $71 |
| Standard Deviation | $54 |
| 90% Confidence Interval | [$2.34, $148] |
The histogram shows the distribution of Expected Cost per DALY (Risk-Adjusted) across 10,000 Monte Carlo simulations. The CDF (right) shows the probability of the outcome exceeding any given value, which is useful for risk assessment.
Monte Carlo simulation confirms that accounting for political risk, the 95% confidence interval for expected cost per DALY maintains dominance over established interventions like bed nets ($89/DALY).
Uncertainty in Cost-Effectiveness (Conditional on Success)
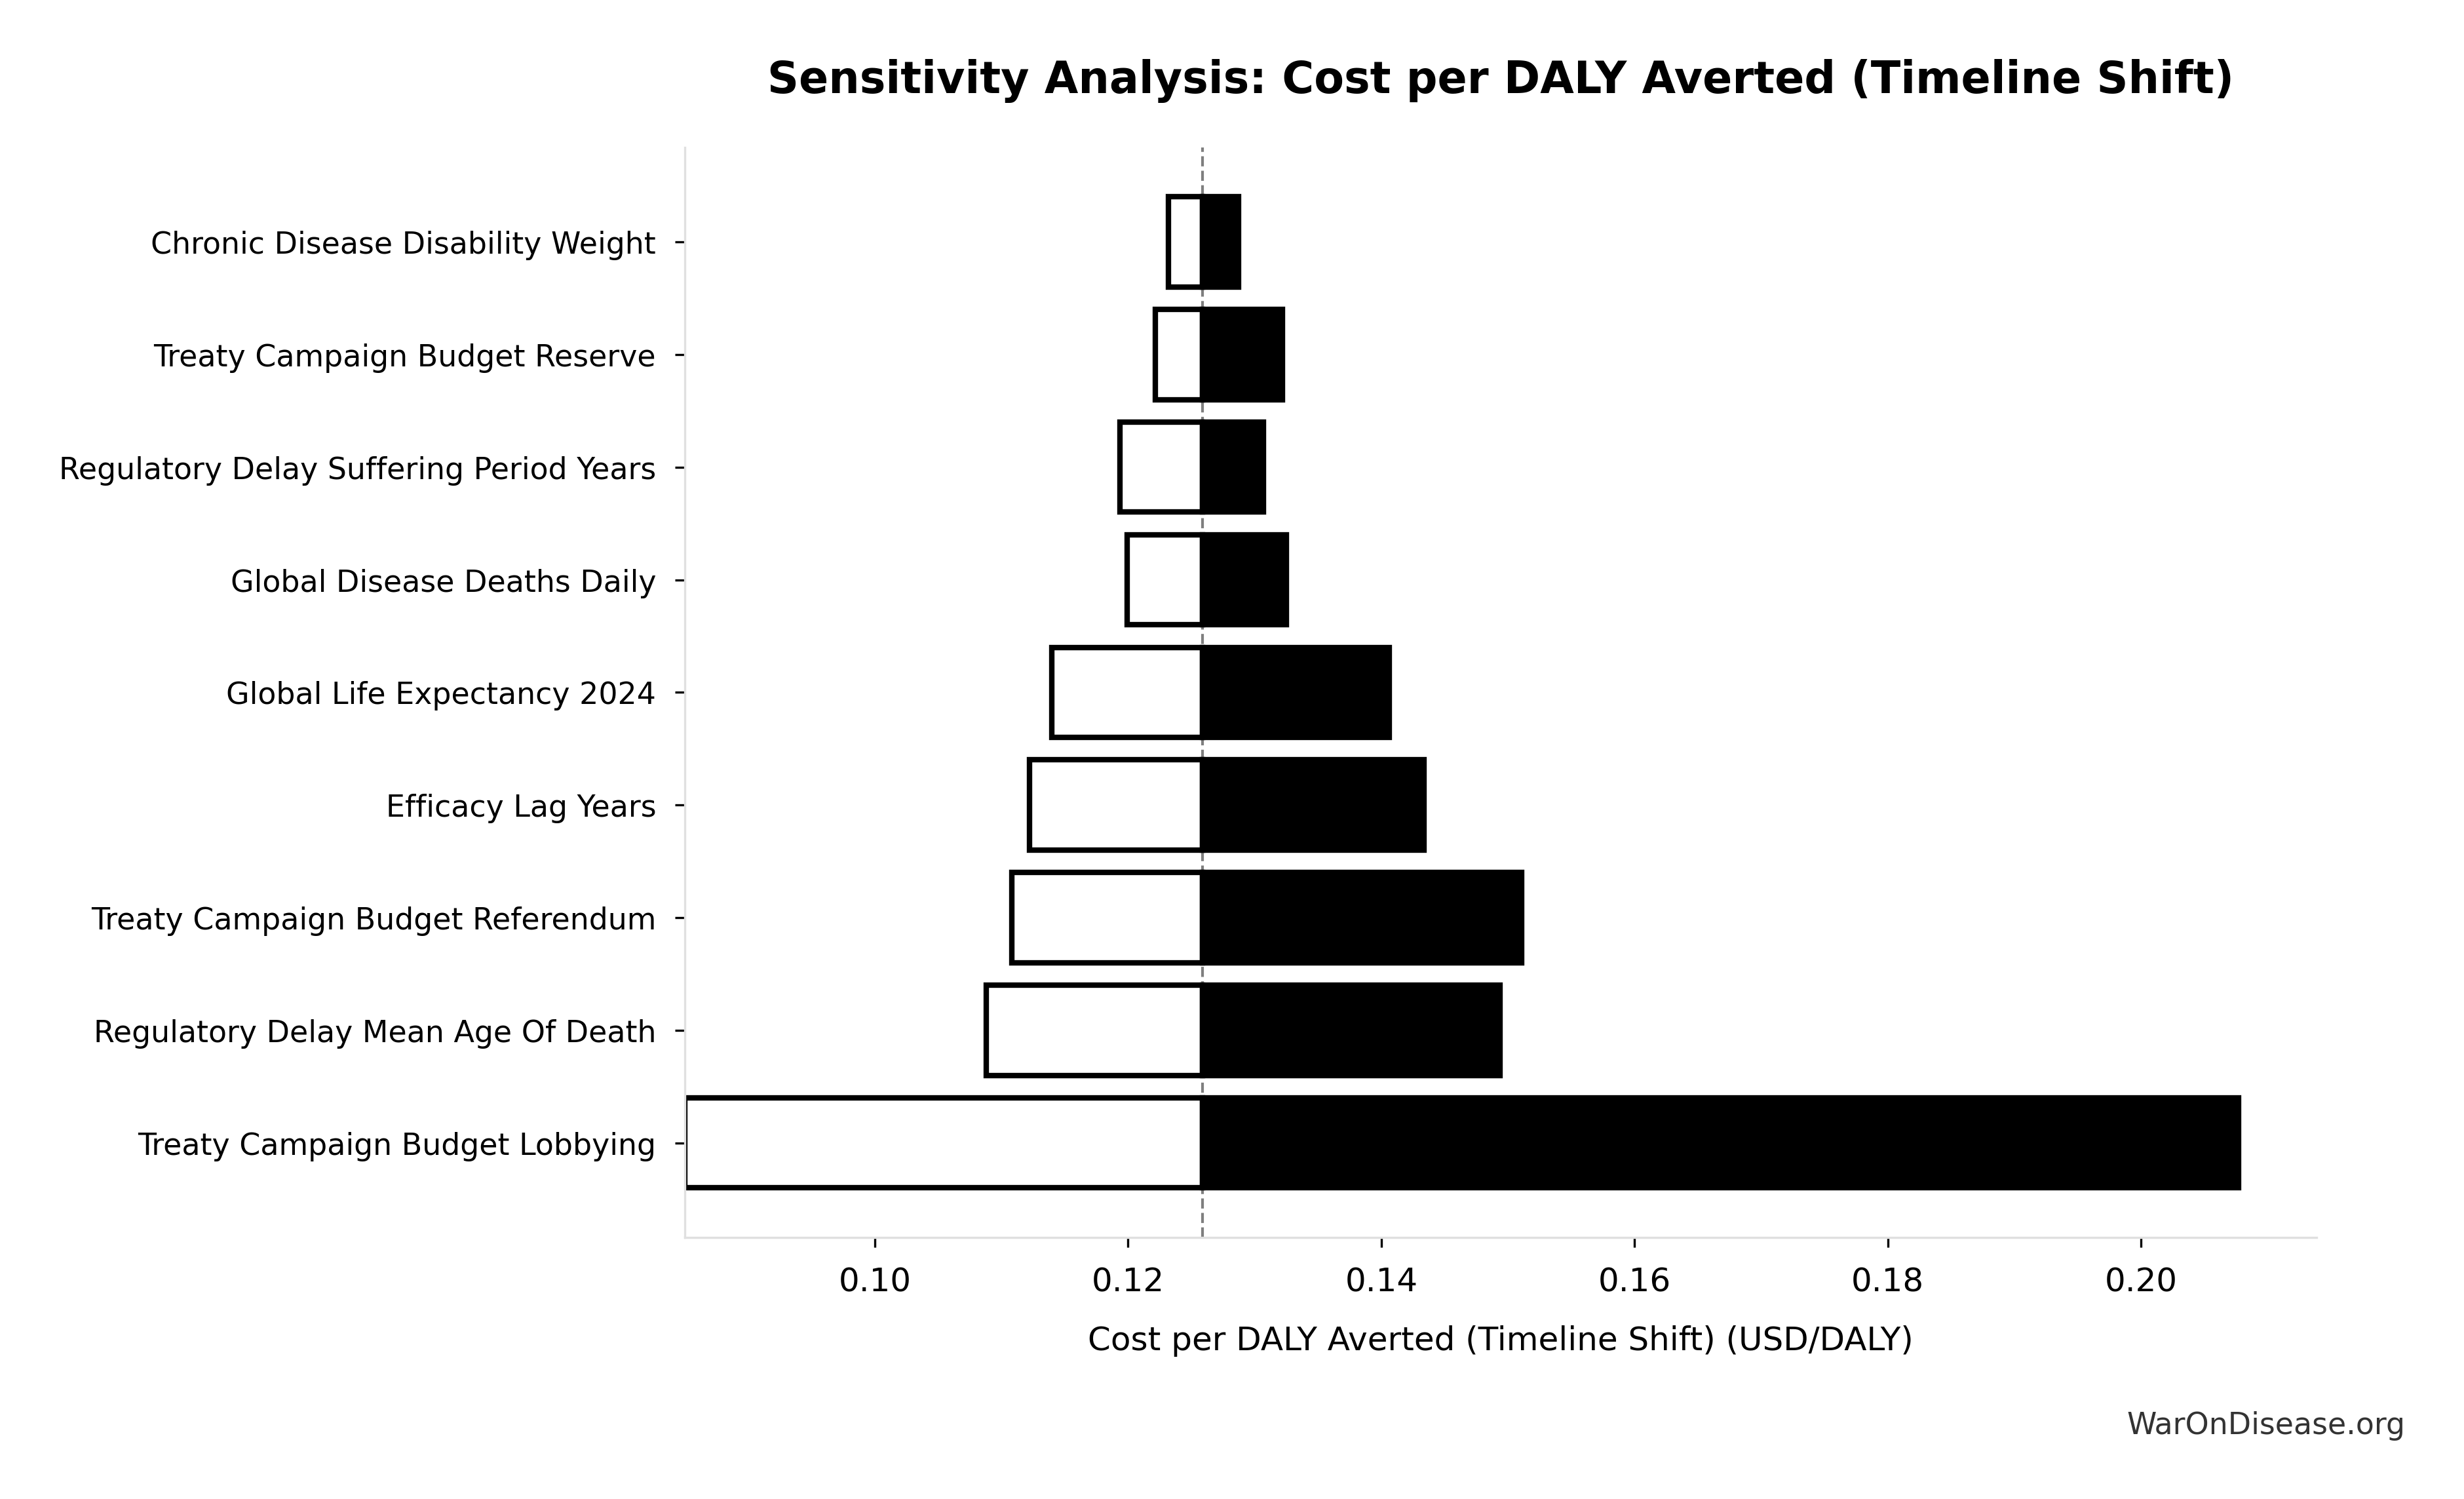
The tornado diagram shows that timeline shift assumptions and discount rate dominate uncertainty in cost-effectiveness. Even under conservative parameter assumptions, the intervention remains highly cost-effective.
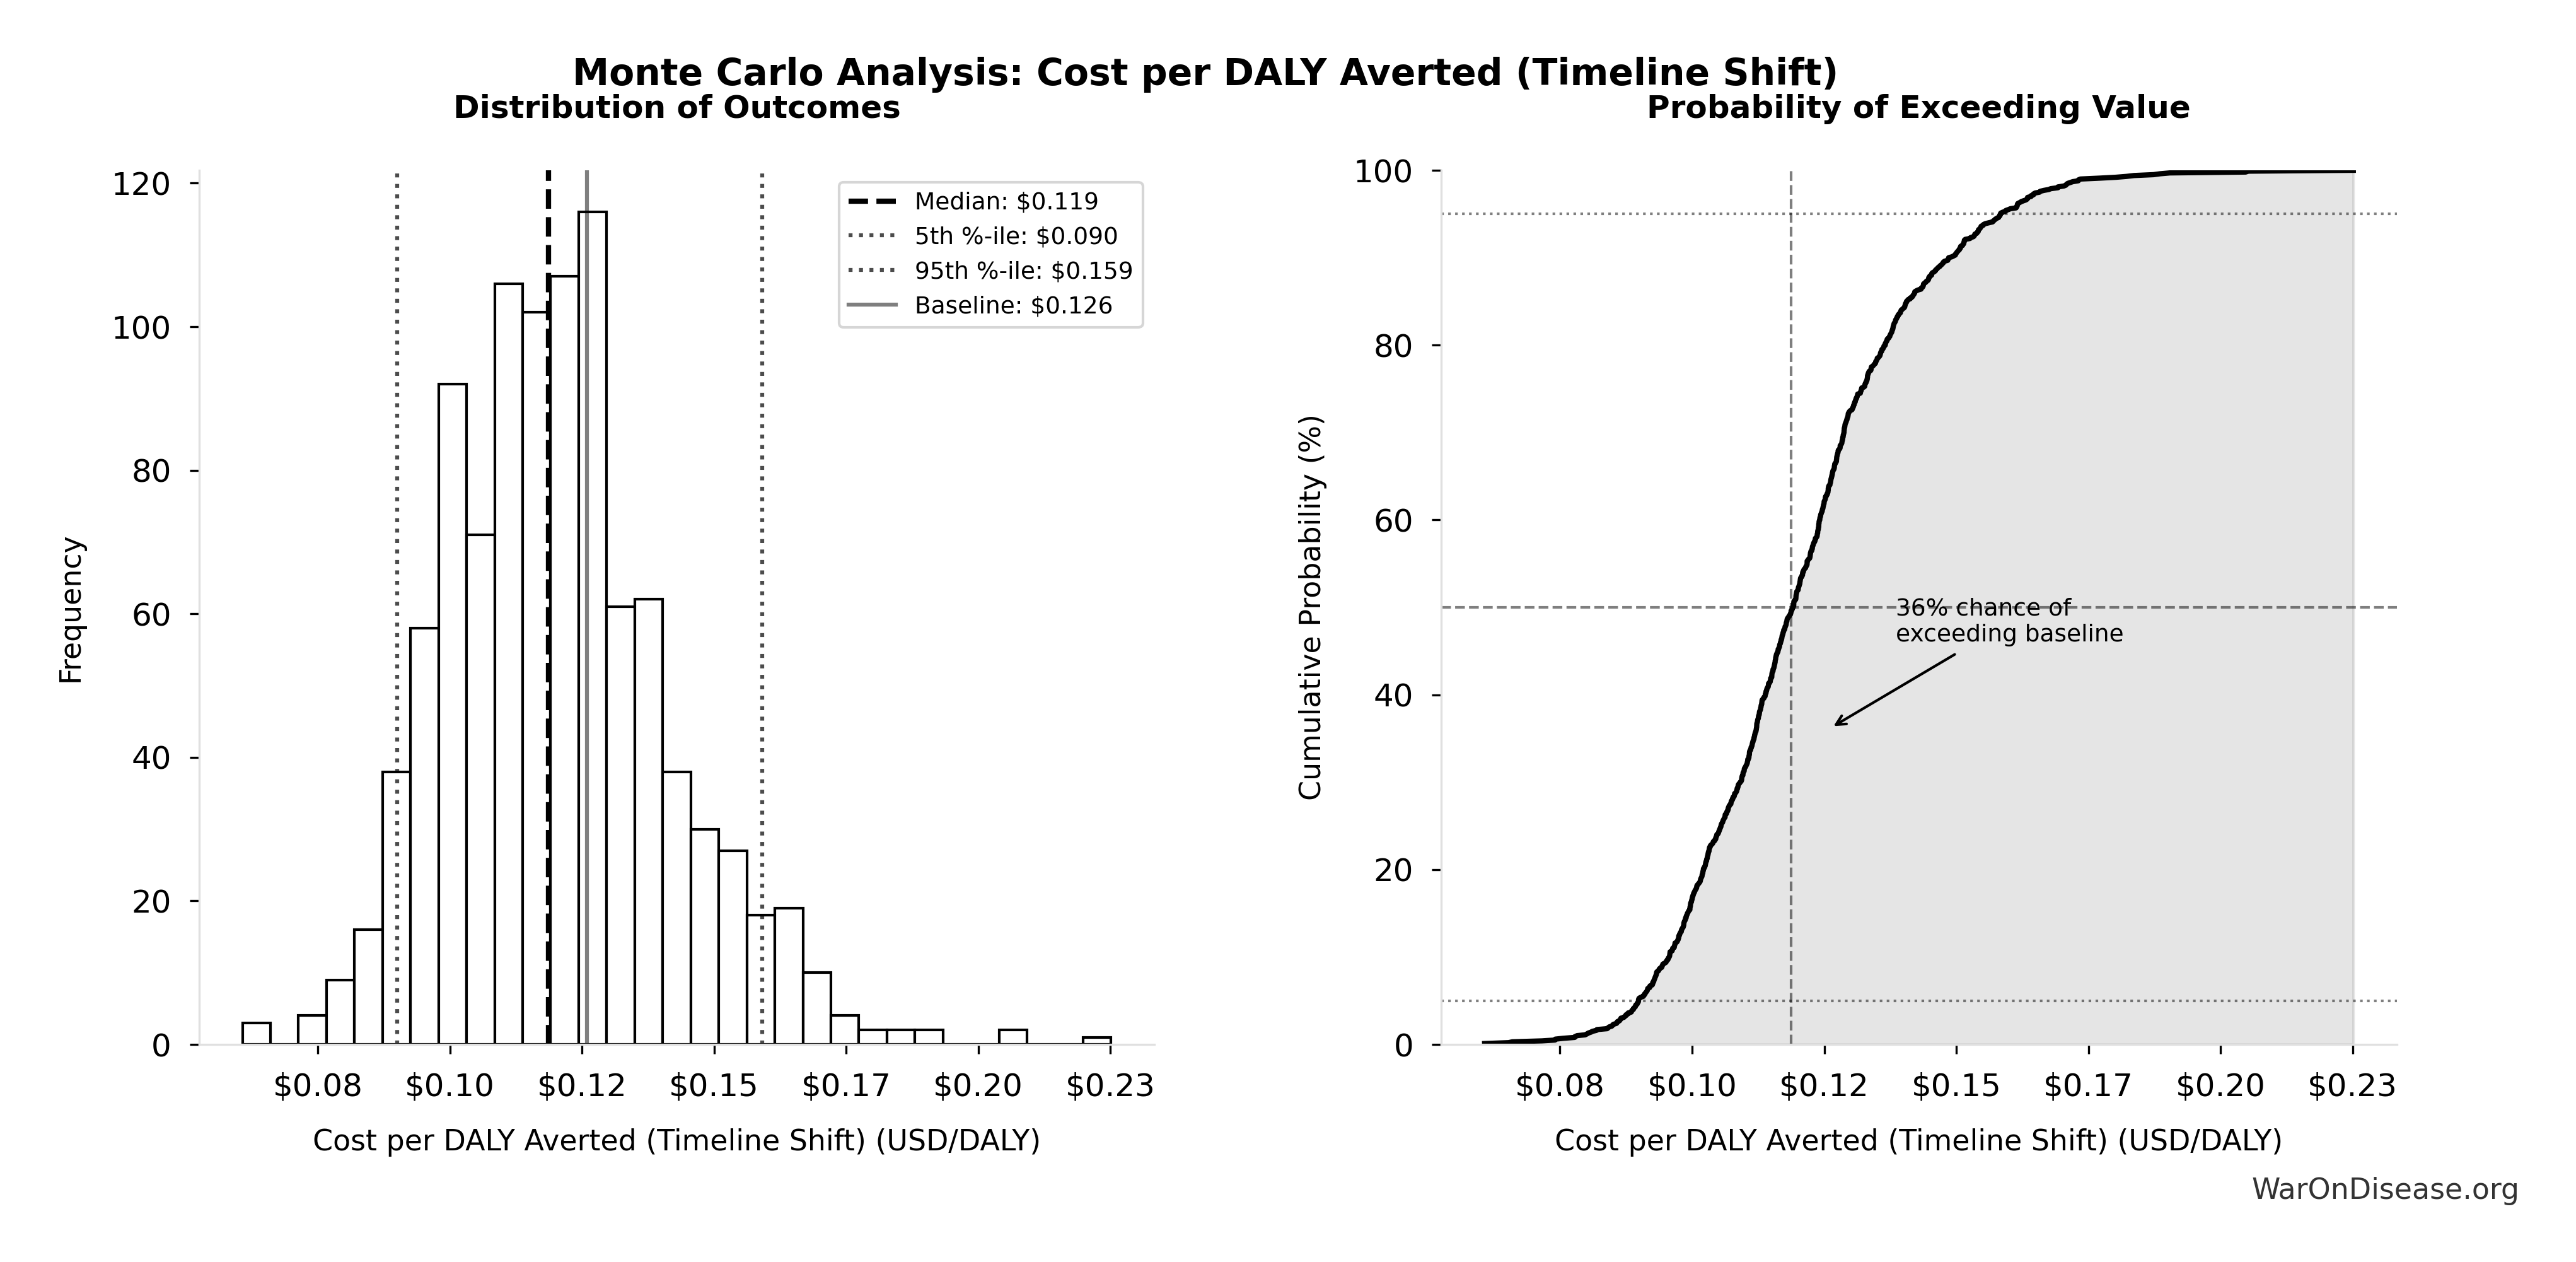
Simulation Results Summary: Cost per DALY Averted (Timeline Shift)
| Statistic | Value |
|---|---|
| Baseline (deterministic) | $0.126 |
| Mean (expected value) | $0.121 |
| Median (50th percentile) | $0.119 |
| Standard Deviation | $0.022 |
| 90% Confidence Interval | [$0.090, $0.159] |
The histogram shows the distribution of Cost per DALY Averted (Timeline Shift) across 10,000 Monte Carlo simulations. The CDF (right) shows the probability of the outcome exceeding any given value, which is useful for risk assessment.
Monte Carlo simulation across 10,000 trials confirms robustness: the 95% confidence interval for cost per DALY remains well below $1/DALY across all scenarios, maintaining dominance over bed nets ($89/DALY).
Accounting for political uncertainty (1% central, 0.1%-10% range), this remains 7.07x more cost-effective than bed nets ($89/DALY) and comparable to deworming, the gold standard.
For context: Ottawa Treaty (landmine ban) was called a “bold gamble” that succeeded with 122 states signing in just 14 months.
The Detailed NPV Formulas (For Spreadsheet Enthusiasts)
For those who need to see the actual equations before believing anything:
NPV of Costs
\[ TotalCost_{NPV} = \$0.26975B + \$0.269B \approx \$0.54B \]
where \(C_{0}\) is upfront costs (platform development, legal structure, data integration), \(C_{\text{op}}(t)\) is annual operating costs in year \(t\) (maintenance, analysis, administration), \(r\) is the discount rate (3%), and \(T\) is the time horizon (10 years).
NPV of Benefits
Note: The NPV calculation includes only annual recurring R&D savings, not the one-time 8.2-year timeline shift in disease eradication. The timeline shift is a separate one-time benefit that occurs when the regulatory delay is eliminated (see Regulatory Mortality Analysis).
Annual benefits \(S(t)\) are calculated as: \[ S(t) = p(t)\alpha R_{d} \]
where \(p(t)\) is the adoption rate at year \(t\) (gradual ramp-up over 5 years), \(\alpha\) is the fraction of R&D costs saved (50% baseline), and \(R_{d}\) is annual global clinical trial spending ($83B Research & Markets (2024)).
The NPV of benefits (R&D savings only): \[ PV_{benefits} = \sum_{t=1}^{10} \frac{NetSavings_{RD} \times \min(t,5)/5}{(1+r)^t} \approx \$249.3B \text{ (5-year linear adoption ramp)} \]
Return on Investment
\[ ROI_{RD} = \frac{\$249.3B}{\$0.54B} \approx 463 \]
This yields the conservative estimate of 451:1 ROI over 10 years.
Important distinction: The NPV calculation above includes only annual recurring R&D savings. However, the QALY and ICER calculations below do include the one-time 8.2-year timeline shift in disease eradication, as this represents the primary health benefit from eliminating the regulatory delay (see Regulatory Mortality Analysis).
For a dFDA’s cost per health benefit averted (8.2-year timeline shift):
Cost per DALY averted: $0.126
This represents $0.126 per year of healthy life gained. The negative ICER (cost-dominant intervention) indicates cost savings while improving health. Standard willingness-to-pay thresholds are $50K-$150K ICER (2024) per QALY; interventions that save costs while gaining QALYs are unconditionally recommended.
NPV of Regulatory Delay Avoidance
The conservative NPV above excludes the one-time benefit from eliminating the regulatory delay (8.2-year timeline shift in disease eradication). However, we can calculate the NPV of this benefit by modeling when it occurs.
Assumption: We assume diseases are cured 100 years in the future on average. If cures occur at year 100, eliminating the regulatory delay brings them 8.2 years earlier (years 92-100). This is a simple timeline shift: the full annual benefit applies for all 8.2 years. Far-future discounting dramatically reduces NPV compared to immediate benefits, but the delay avoidance still provides value.
The NPV of regulatory delay avoidance (assuming average cure time of 100 years):
Using the disease eradication delay benefit of $1.19 quadrillion, applied across 8.2 years with future discounting at 3%.
This yields an NPV assuming cures occur 100 years in the future on average. The discount factor at year 92 (when benefits begin) is approximately (1 + 3%)^92, making far-future benefits much smaller than if they occurred immediately.
Calculation details: The full annual benefit ($1.19 quadrillion) applies for all 8.2 years (years 92-100), with each year’s value discounted back to present. This represents the monetized value of 8.2 years of QALYs/DALYs that occur 100 years in the future, shifted 8.2 years earlier by eliminating the regulatory delay.
Comparison: The regulatory delay avoidance benefit ($1.19 quadrillion annually) is substantially larger than the conservative R&D-only benefit ($275B:1 ROI), demonstrating that health outcomes substantially exceed cost savings even with far-future discounting. Note: These are separate benefit streams; the delay avoidance benefit does not include R&D savings.
Key insight: Eliminating the regulatory delay still provides value even if cures are 100 years away on average, but far-future discounting means the NPV is much smaller. The actual value depends on when diseases are actually cured, which varies by disease category. Some may be cured in 10-20 years (moderate discounting), others in 50-100+ years (heavy discounting). The 100-year assumption is conservative for many diseases that may take decades to cure.
Quality-Adjusted Life Year (QALY) Valuation
QALYs represent the standard metric in health economics for comparing health interventions across different conditions and treatment modalities. One QALY equals one year of life in perfect health.
QALY Calculation Model
The total annual QALY gain (7.94B QALYs baseline) derives from three distinct benefit streams:
A. Accelerated Development of Existing Pipeline Drugs
Health gains from bringing effective treatments to patients faster through shortened development and approval timelines:
- Baseline: Research shows treatment delays significantly increase cancer mortality, with studies indicating approximately 10% increased risk per month of delay (systematic review)
- Estimate: 2-year average acceleration across pharmaceutical pipeline
- Impact: Significant contribution to the total 7.94B DALYs averted from the one-time timeline shift
B. Improved Preventative Care via Real-World Evidence
Value of using comprehensive data to optimize preventative care and treatment effectiveness:
- Baseline: Cancer screenings alone have saved millions of life-years; significant untapped potential remains
- Mechanism: Large-scale identification of at-risk populations and real-world effectiveness measurement
- Impact: Contributes to the total 7.94B DALYs averted
C. Enabling Research for Previously Untreatable Diseases
Transformative potential to create viable research pathways for conditions ignored due to high trial costs:
- Baseline: 7.00k GAO (2025)+ rare diseases, 95% lack FDA-approved treatments
- Mechanism: Radically lower per-patient costs make rare disease R&D economically feasible
- Impact: Major contributor to the total 7.94B DALYs averted
QALY Valuation: Standard economic valuations range from $50K-$150K ICER (2024) per QALY. This analysis uses conservative mid-range values.
The distribution below shows the uncertainty range in DALYs averted from the 8.2-year timeline shift, based on Monte Carlo simulation of input parameter uncertainty:
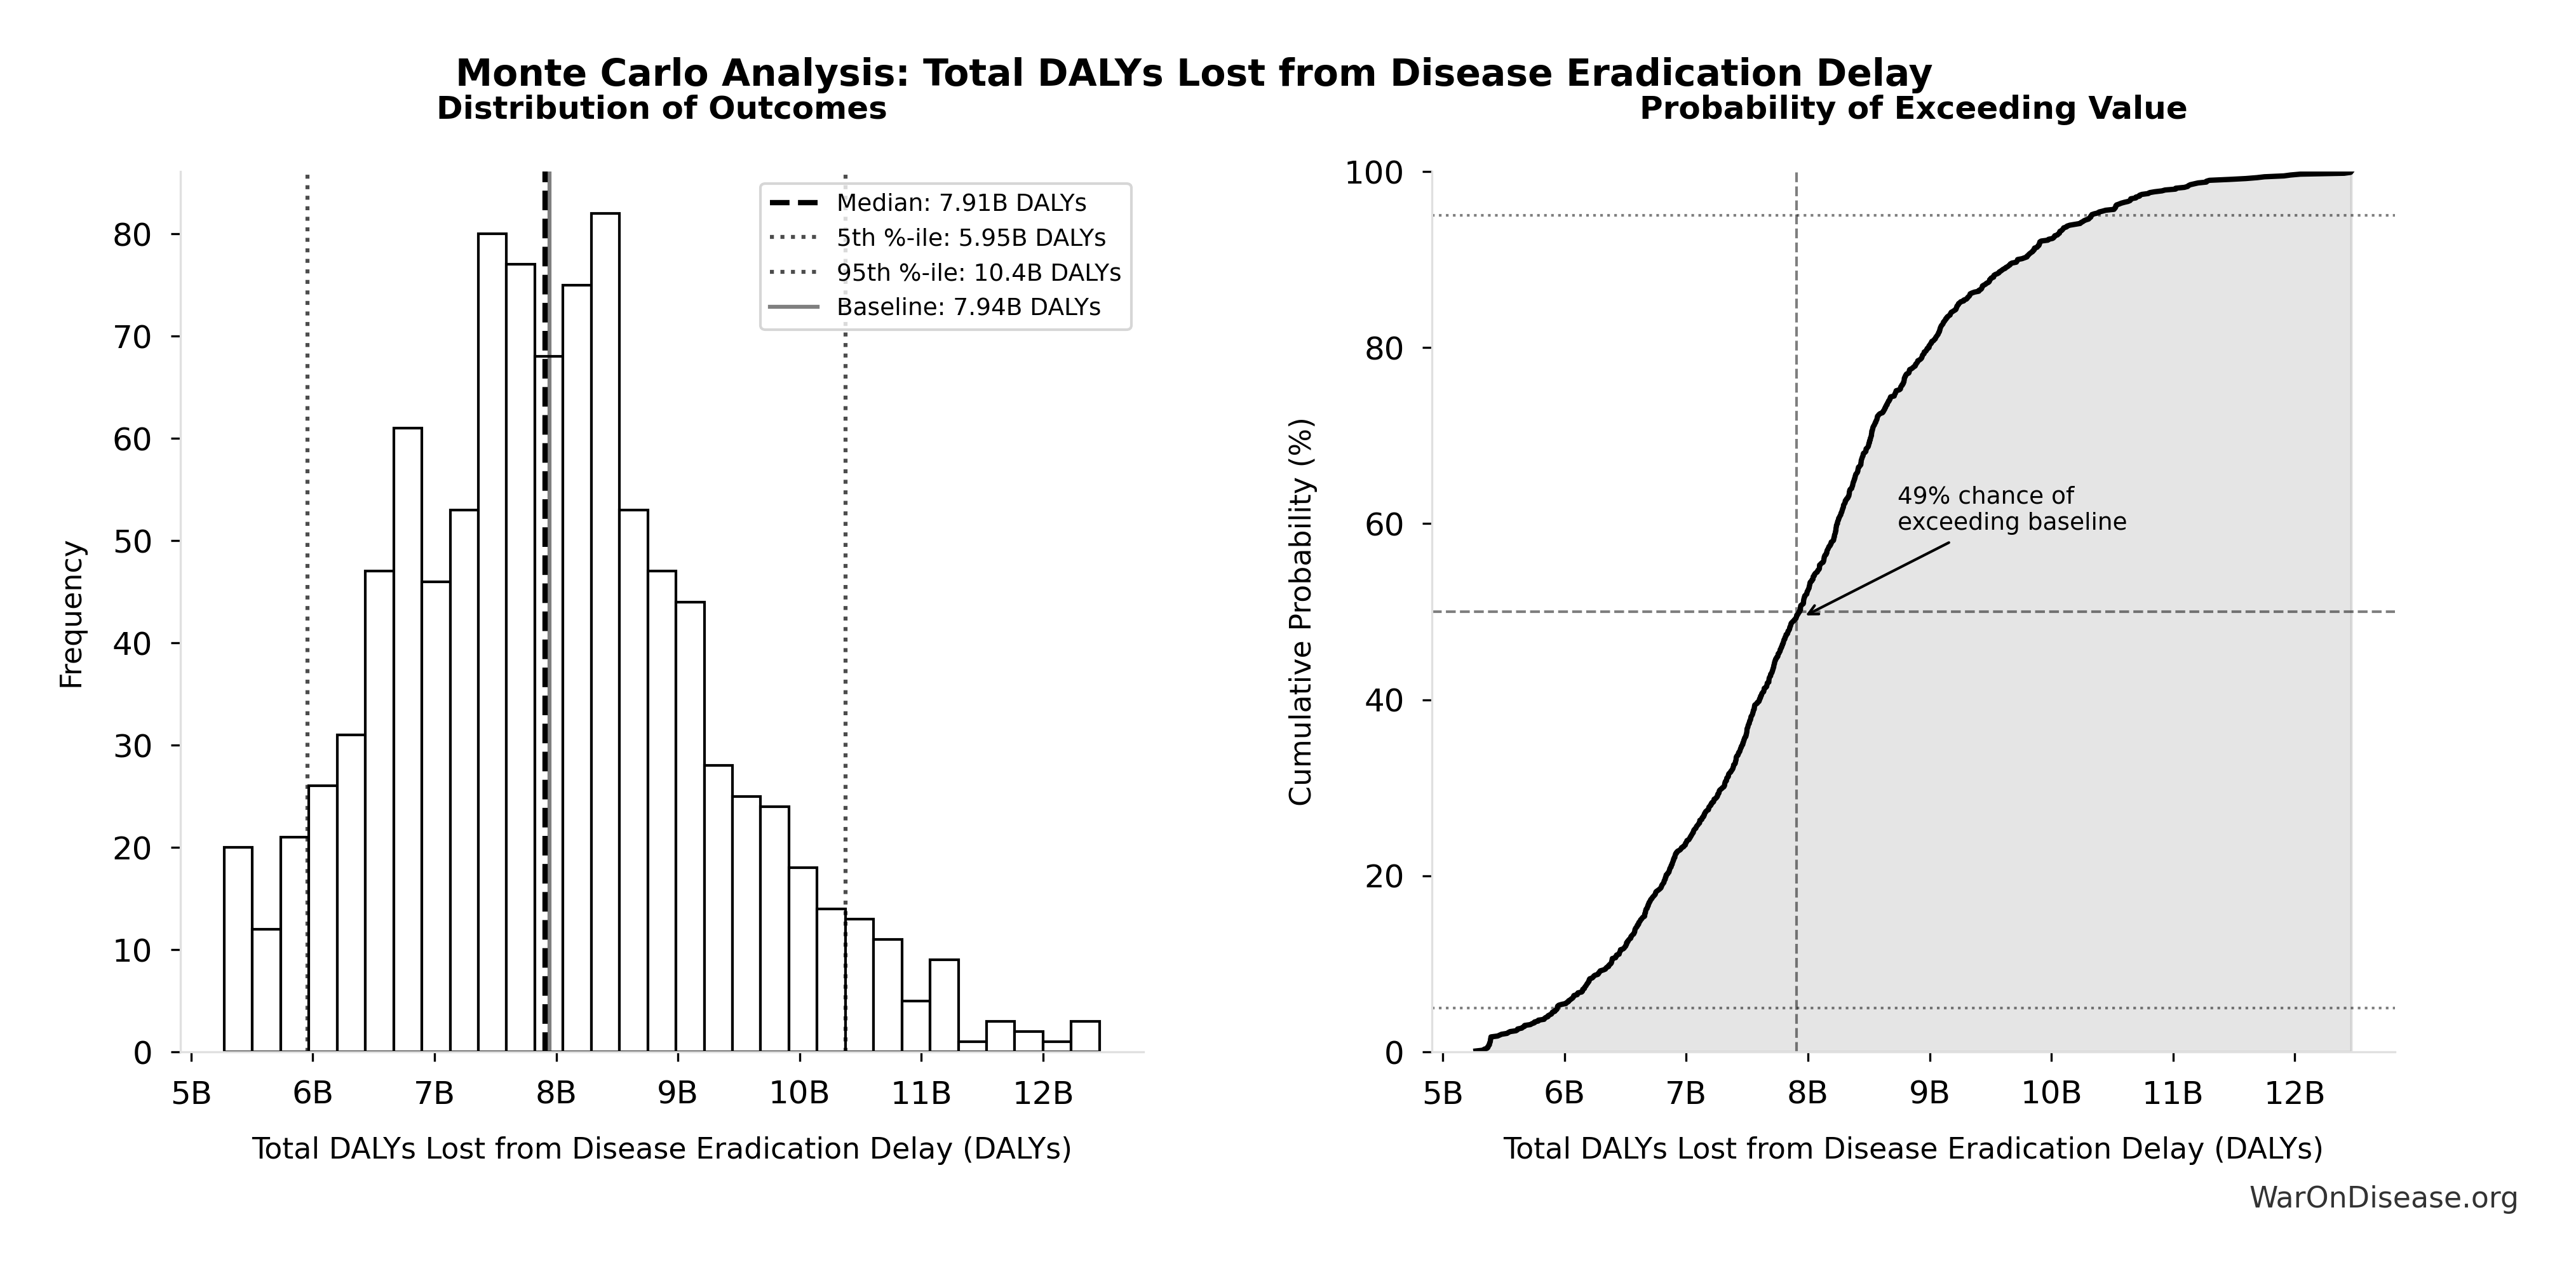
Simulation Results Summary: Total DALYs Lost from Disease Eradication Delay
| Statistic | Value |
|---|---|
| Baseline (deterministic) | 7.94B |
| Mean (expected value) | 8.01B |
| Median (50th percentile) | 7.91B |
| Standard Deviation | 1.33B |
| 90% Confidence Interval | [5.95B, 10.4B] |
The histogram shows the distribution of Total DALYs Lost from Disease Eradication Delay across 10,000 Monte Carlo simulations. The CDF (right) shows the probability of the outcome exceeding any given value, which is useful for risk assessment.
For detailed DALY calculation methodology, see Regulatory Mortality Analysis.
Counterfactual Baseline Specification
This cost-effectiveness analysis uses the status quo as the baseline counterfactual: military spending continues at current levels ($2.72T SIPRI (2025) annually) and is allocated to traditional military purposes. Under this baseline, the $27.2B redirected to pragmatic clinical trials infrastructure would otherwise remain in military budgets.
Alternative counterfactual scenarios include:
Military R&D continuation: The $27.2B continues funding military research and development, potentially yielding civilian technology spillovers (e.g., GPS, internet protocols, materials science advances). This scenario is partially addressed in the peace dividend calculations, which acknowledge that military spending generates economic multiplier effects of 0.5-1.0× compared to pragmatic clinical trial multipliers of 2.0-3.0×.
Return to taxpayers: Funds are returned via tax cuts, enabling private consumption and investment. Under this scenario, the opportunity cost equals the weighted average return on private capital (approximately 3% annually in developed economies).
Alternative government priorities: Reallocation to other public investments such as infrastructure, education, or climate mitigation. Each alternative use would require separate cost-benefit analysis to determine relative efficiency.
Methodological note on baseline selection: The economically rigorous baseline is the “next best alternative use” rather than “status quo continuation.” However, identifying the single next-best alternative requires comprehensive comparison across all possible uses of public funds, which exceeds the scope of this analysis. This analysis therefore focuses on the conditional benefits of a dFDA: the health and economic gains achievable by redirecting $27.2B from military to medical research infrastructure.
Conservative interpretation: Even if alternative uses generate positive economic value, a decentralized framework for drug assessment infrastructure exhibits dominant intervention characteristics (cost-dominant: $0.126 per DALY), indicating it saves costs while improving health outcomes. Under standard cost-effectiveness frameworks, dominant interventions are unconditionally recommended regardless of alternative uses, as they represent free gains in both dimensions (reduced costs and improved health).
Peace Dividend Calculation Methodology
The peace dividend represents economic benefits from reduced military spending. The 1% Treaty redirects 1% of global military spending ($2.72T SIPRI (2025) in 2024) = $27.2B annually.
Economic benefits of reduced military spending
- Direct fiscal savings (Cash): $27.2B available for productive investment. This is the floor.
- Diplomatic De-escalation (Upside): Reduced conflict-related economic damage (trade disruption, infrastructure destruction, refugee costs).
Opportunity Cost & Signal Value: The argument isn’t just that 1% less budget stops 1% of bullets linearly. It’s that 1% redirected to shared survival goals (curing disease) acts as a confidence-building measure (CBM) in arms control theory. It signals a shift from zero-sum competition to positive-sum cooperation.
Conservative estimate: Analysis uses $114B annual peace dividend. Even if conflict intensity doesn’t drop linearly, the $27.2B annual cash reallocation is real. The ROI works on the cash alone; peace is a massive bonus.
For detailed calculations, see Peace Dividend Analysis.
Confidence level separation: The peace dividend calculation separates into two components:
Direct fiscal savings (high confidence): $27.2B - The 1% reduction in military budgets ($27.2B) represents direct fiscal savings with high certainty. These funds are immediately available for reallocation.
Conflict reduction benefits (upside scenario): $86.4B - The remaining $86.4B models the benefits if conflict costs reduce proportionally. While the causal link between marginal budget cuts and conflict intensity is complex, the directionality is positive.
Conservative interpretation: The direct fiscal savings ($27.2B annually) are certain. The “peace dividend” is treated as an upside scenario in the conservative case, ensuring the economic model doesn’t rely on optimistic geopolitical outcomes. The ROI remains positive on R&D savings alone.
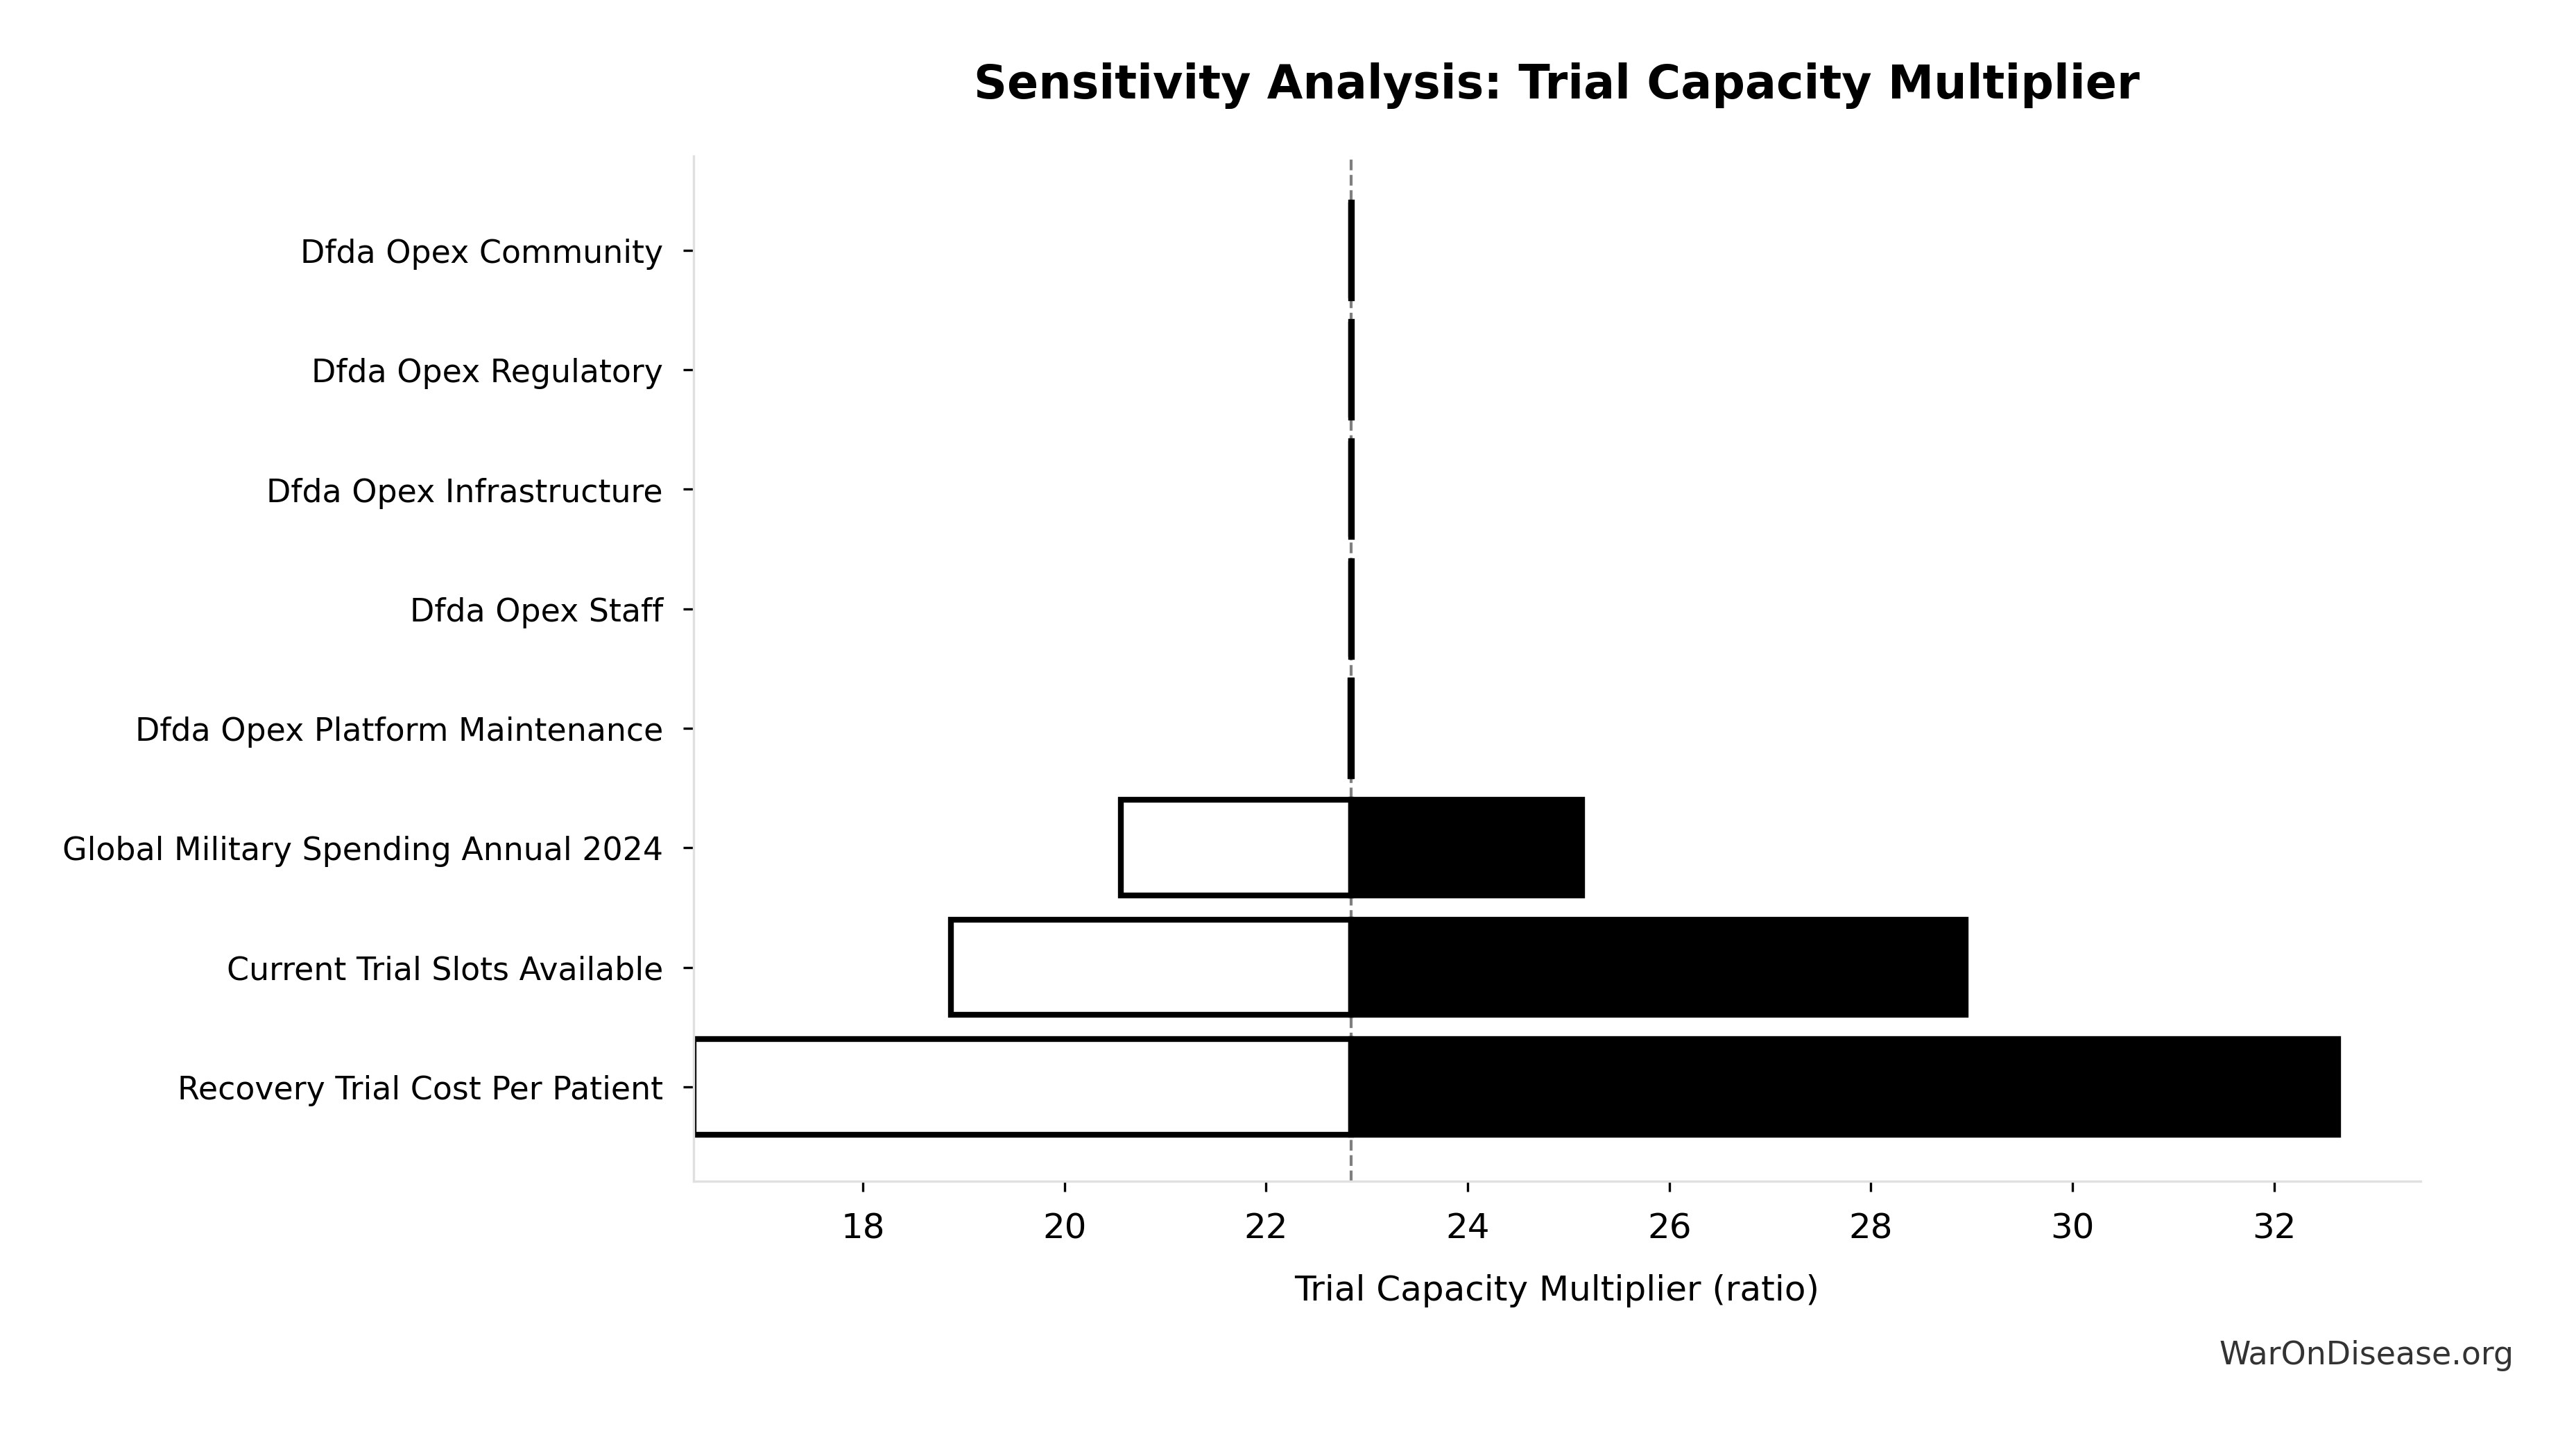
Research Acceleration Mechanism
The 22.8× research acceleration multiplier comes from the combination of multiple proven accelerators:
Faster Recruitment: The Oxford RECOVERY trial recruited 47,000+ patients across nearly 200 hospitals, while 80% of traditional trials fail to meet enrollment timelines. This speed comes from pragmatic eligibility (minimal exclusions vs. 86% excluded traditionally) and embedded recruitment in routine care.
Faster Completion: Pragmatic trials complete in 3-12 months instead of 3-5 years because patient subsidies flip economic incentives. Physicians gain revenue from trial participation rather than losing it, eliminating the perverse incentives that delay traditional trials.
Massive Parallelization: With more trials running simultaneously (vs. 10.0k via today), the system achieves substantially more concurrent research. Universal patient participation makes this possible, as every doctor’s office becomes a trial site.
Higher Completion Rates: More of pragmatic trials complete (vs. 40% estimates abandonment rate today) because patients are subsidized and physicians profit from participation.
Increased Funding: A 1% treaty adds $27.2B to the current $67.5B budgets: baseline, increasing total research funding to $94.7B (1.4× increase).
These improvements compound multiplicatively to produce the 22.8× acceleration used in this analysis. This is a conservative estimate accounting for implementation constraints, regulatory requirements, and gradual adoption.
Sensitivity of research acceleration estimate: The tornado chart below shows which input parameters have the largest impact on the trial capacity multiplier. The width of each bar shows how much the multiplier changes when that parameter varies across its uncertainty range:
Automating Friction, Not Judgment: A dFDA operates as automated infrastructure analyzing time-series EHR data from electronic health records, wearables, and apps. The 22.8× research acceleration does not require 22.8× more Principal Investigators.
The bottleneck in clinical research isn’t “scientific genius”, we have plenty of underemployed PhDs. The bottleneck is “Data Friction”.
Currently, researchers spend up to 50% of their time on grants and administrative tasks. A decentralized framework for drug assessment automates this overhead, liberating human judgment to focus on hypothesis generation and complex safety signal interpretation.
The TurboTax Analogy: Just as TurboTax wraps the complexity of federal, state, and local tax codes into a simple interface (you answer questions, it generates compliant filings), a decentralized framework for drug assessment wraps the complexity of global regulatory bodies (FDA, EMA, PMDA, Health Canada, TGA, etc.) into a unified framework. Researchers define their hypothesis and patient population; the framework automatically:
- Generates IRB submissions for each jurisdiction
- Handles liability insurance and indemnification
- Creates compliant protocol documents for each agency
- Submits applications simultaneously to multiple regulatory bodies
- Aggregates real-world evidence into agency-specific formats
- Manages ongoing reporting requirements across jurisdictions
The framework uses federated queries (data stays in Epic/Cerner/Apple Health systems) rather than centralized databases, enabling analysis without data movement. Physicians continue normal clinical practice; the framework automatically detects patterns, identifies treatment effects, and flags signals for peer review. This is fundamentally different from traditional research models that scale linearly with researcher headcount.
Data Sources and Primary Inputs
Military and Conflict Data
- Global military spending: SIPRI Military Expenditure Database ($2.72T SIPRI (2025) annually)
- Conflict deaths: Armed Conflict Location & Event Data Project (ACLED), Global Terrorism Database (GTD), Uppsala Conflict Data Program (UCDP)
Clinical Trial Economics
- Global trial market: Global Clinical Trials Market Report 2024 ($83B Research & Markets (2024) annually)
- Cost reduction benchmarks: Oxford RECOVERY Trial (82 M. Institute× cost reduction demonstrated)
- Trial completion rates: ClinicalTrials.gov database (3.30k Research & Markets (2024) trials initiated annually, 40% estimates completion rate)
Health Economics
- QALY valuations: ICER QALY Methodology, NBER working papers (Glied & Lleras-Muney, Philipson et al.)
- Disease burden: WHO Global Health Observatory
- Rare diseases: National Organization for Rare Disorders (NORD)
Economic Parameters
- Discount rate: 3% (standard health economics practice)
- Time horizon: 10 years (standard for infrastructure investments)
- Value of statistical life: $10M DOT (2024) (EPA/DOT standard)
All data sources include confidence levels and last-update dates. See References for complete bibliography.
Sensitivity Analysis Approach
The analysis employs comprehensive sensitivity testing across multiple scenarios to assess robustness of findings:
Conservative Scenario (451:1 ROI):
- R&D cost reduction: 50%
- QALY gains: 7.94B annually
- Adoption timeline: 5 years to full adoption
- Includes only R&D efficiency savings (excludes peace dividend and six additional benefit categories)
Optimistic Scenario (1.19M:1 ROI):
- R&D cost reduction: 50% (RECOVERY trial-like efficiency)
- QALY gains: 7.94B annually
- Faster adoption and broader scope
Complete Case (1.19M:1 ROI):
- Includes all eight quantifiable benefit categories
- Peace dividend: $114B
- Earlier treatment access, research acceleration, rare disease treatments, drug price reductions, prevention medicine, mental health benefits
Probabilistic sensitivity analysis: We ran 10,000 Monte Carlo simulations where each uncertain parameter was randomly sampled from probability distributions. The chart below shows the resulting ROI distributions with 95% confidence intervals.
What we varied: Cost reduction (50-95%), political success probability (0.1%-10%), adoption timeline (3-8 years), discount rate (1-7%), and QALY gains (0.7-1.3× baseline).
Economic interpretation: ROI > 1:1 means benefits exceed costs. All simulations produce ROI > 1:1, meaning there is effectively zero probability (within the modeled uncertainty) that this intervention loses money. Even the most conservative scenario (R&D savings only at 451:1) generates positive returns. This qualifies as a dominant intervention in health economics: it should be implemented regardless of budget constraints, as it generates net economic surplus while improving health outcomes.
Which parameters matter most for conservative ROI? The tornado chart below shows the sensitivity of the R&D-only ROI estimate to each input parameter. Parameters at the top have the largest impact on the final result:
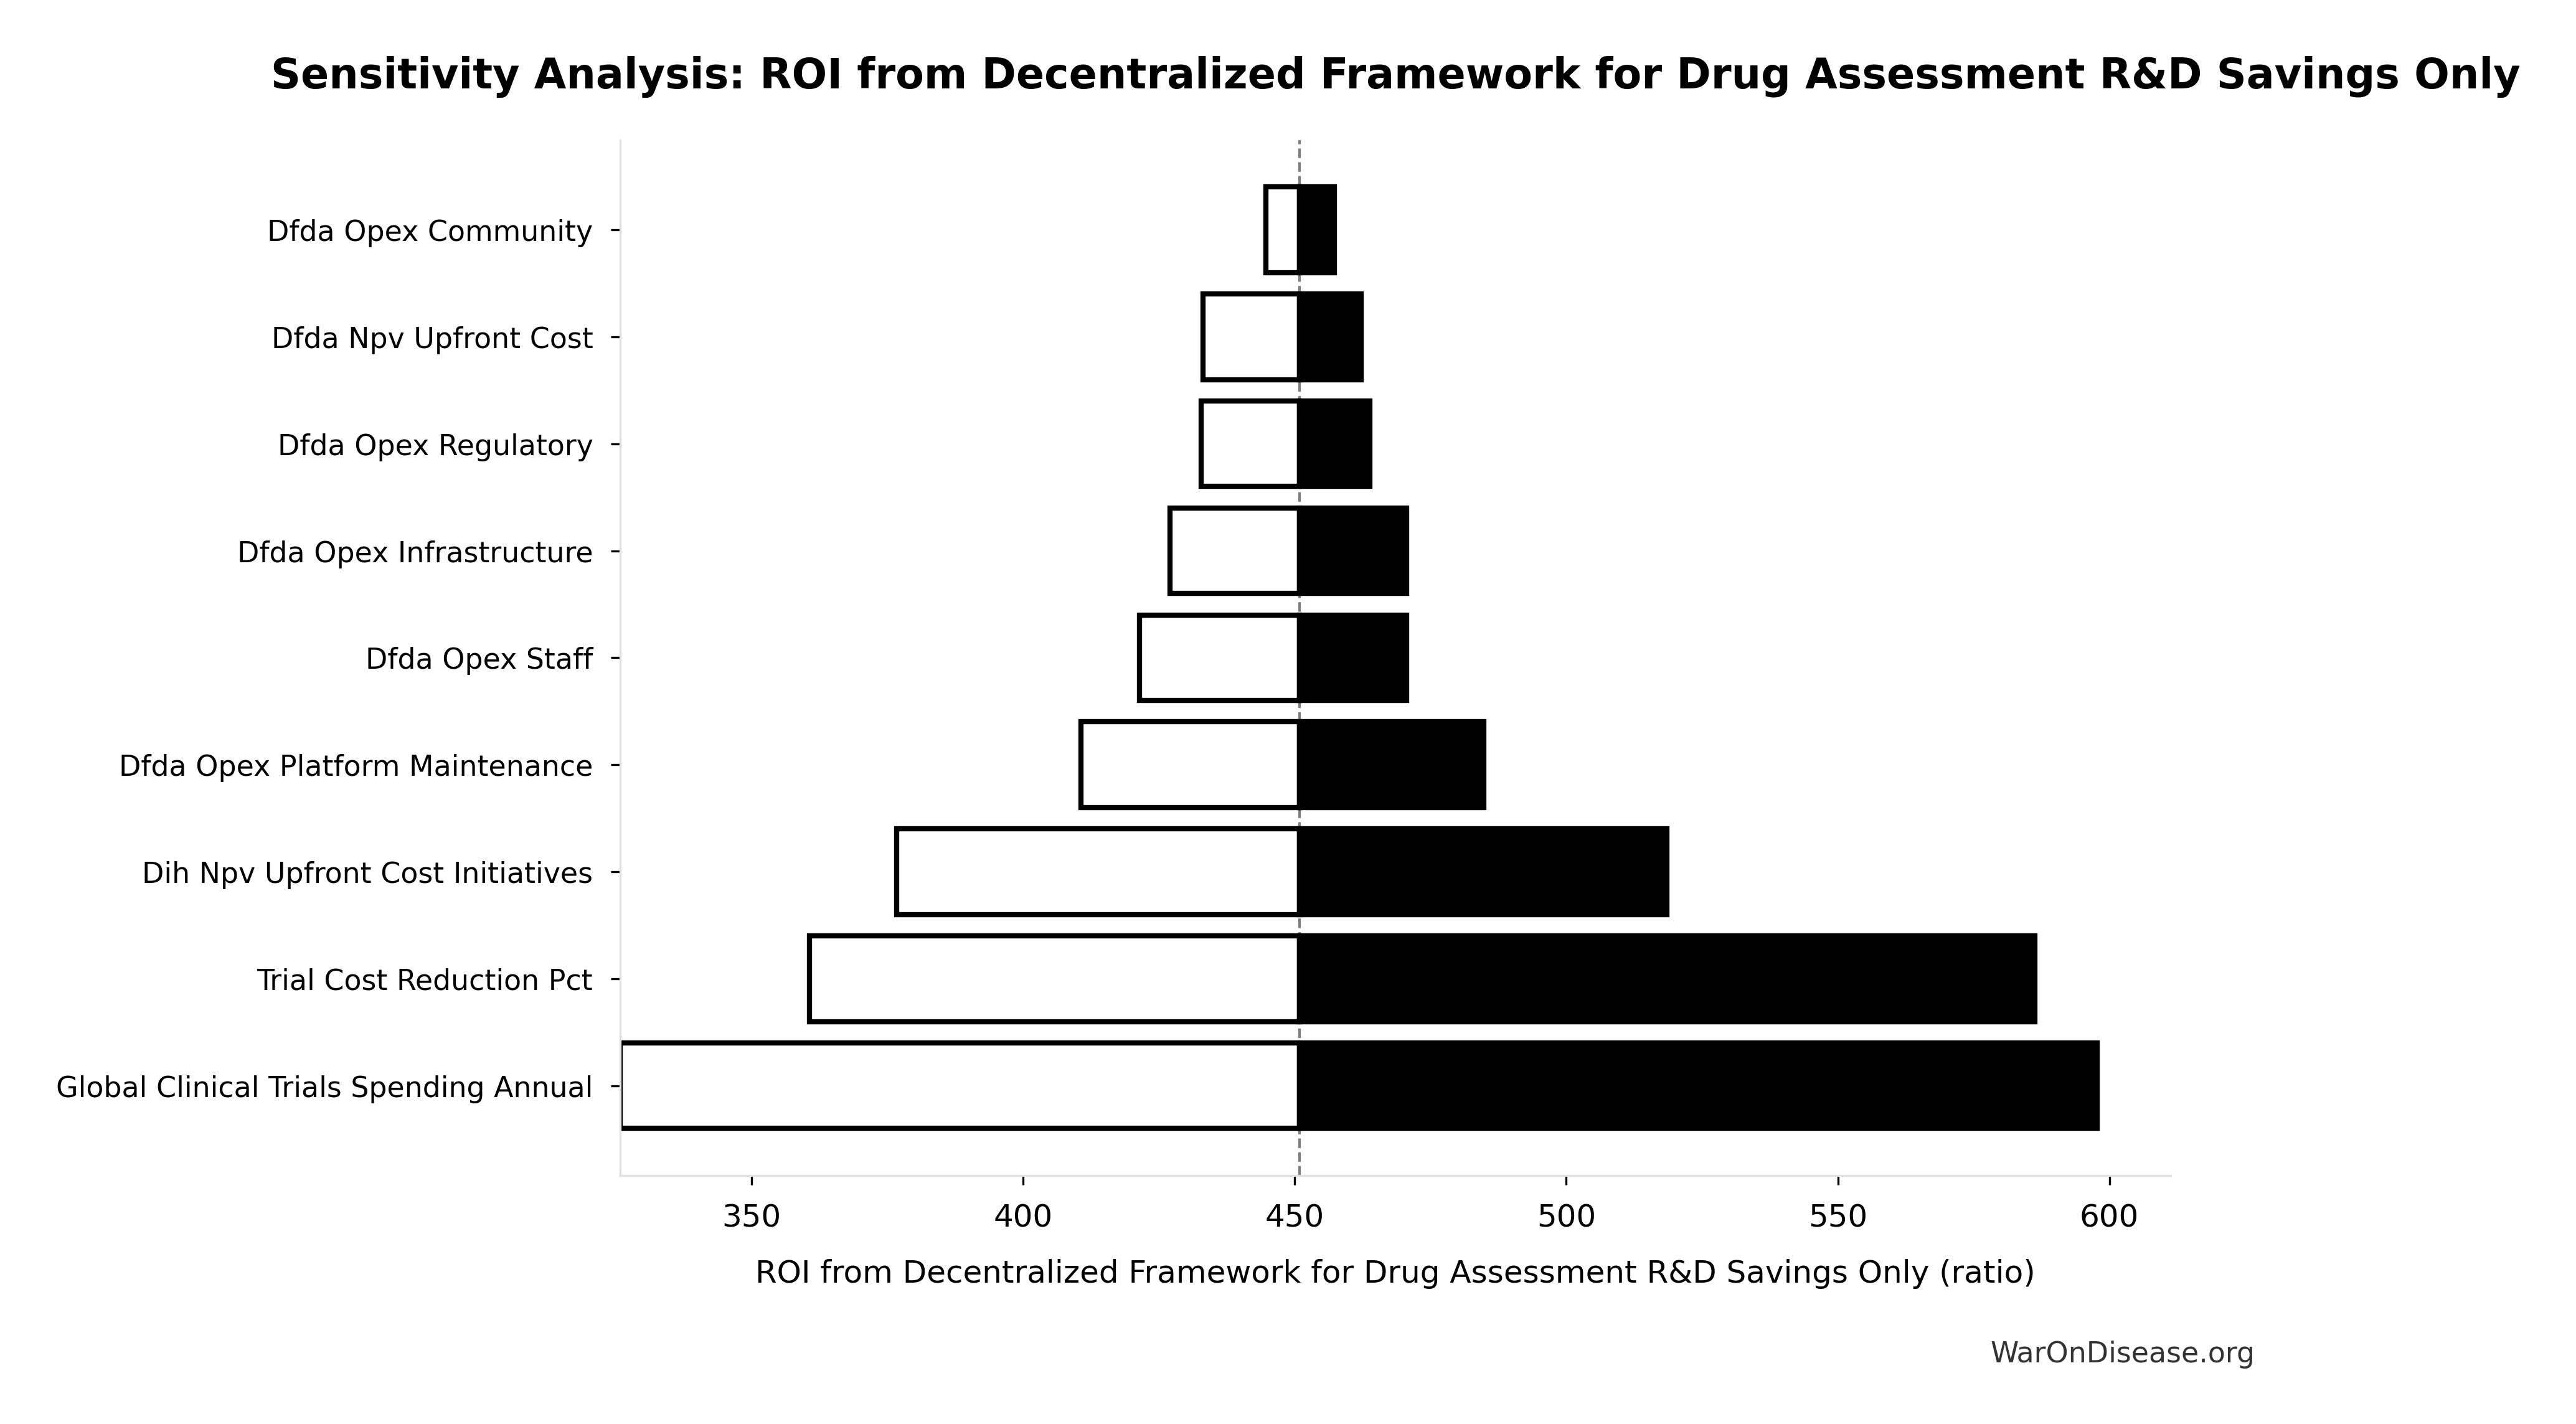
For comprehensive sensitivity analysis including tornado charts for all calculated parameters, see Parameters and Calculations.
Key Analytical Assumptions
This analysis rests on several core assumptions that should be made explicit for academic transparency:
Strategic Stability Assumption
Assumption: A coordinated 1% reduction in military spending across all nations maintains relative power balances and strategic deterrence capabilities.
Justification: The 1% Treaty explicitly requires proportional reductions from all signatories. Since relative military capabilities remain unchanged, strategic stability is preserved. Historical analysis shows that symmetric reductions in military tensions (e.g., START treaties, naval treaties between world wars) maintained deterrence while reducing absolute expenditure.
Sensitivity: This assumption is critical to the peace dividend calculation. Alternative scenarios modeling unilateral reductions would require different political economy frameworks.
Linear Scaling Assumption
Assumption: Economic benefits and costs scale approximately linearly with program scope and adoption rates.
Justification: Conservative assumption that costs scale with system usage. Research acceleration benefits may exhibit superlinear returns (network effects, data abundance), making this assumption conservative.
Adoption Rate Assumptions
Assumption: A dFDA achieves gradual adoption following a 5-year linear ramp to 50%-80% participation rate among eligible trials.
Conservative case: 50% of trials adopt dFDA methodology Optimistic case: 80% adoption rate
Justification: Based on historical adoption curves for electronic health records (5-10 years to majority adoption), clinical trial registry systems, and FDA Sentinel System implementation.
Adoption realism considerations: Technology adoption typically follows S-curve dynamics with critical mass thresholds rather than linear ramps. Coordination failure risk exists (prisoner’s dilemma: pharmaceutical companies may prefer others adopt first). Mitigation: Economic incentives (82× cost reduction) create overwhelming financial motivation for early adoption. Regulatory harmonization across jurisdictions may extend to 10-20 years rather than the modeled 5-year timeline, though pilot programs in willing jurisdictions (UK MHRA, which accepted RECOVERY evidence) can establish proof-of-concept earlier.
Sensitivity: NPV calculations explicitly model adoption uncertainty through gradual ramp-up rather than immediate full adoption. Conservative scenario (50% adoption) accounts for coordination failures and regulatory delays.
Cost Reduction Assumptions
Assumption: The methodology of a decentralized framework for drug assessment reduces per-patient trial costs by 50% (conservative) to 95% (optimistic) compared to traditional randomized controlled trials.
Empirical basis
- Oxford RECOVERY trial: 82 M. Institute× cost reduction ($500 Oren Cass (2023) per patient vs. $80K J. I. Medicine traditional)
- ADAPTABLE trial: Similar cost structure using pragmatic design
- Literature on pragmatic trials consistently shows 50-95% cost reductions
Sensitivity: Conservative scenario (451:1 ROI) uses 50% reduction; optimistic case uses 95%.
Historical Precedent: Pre-1962 Physician-Led Efficacy Trials
Context: The decentralized framework for drug assessment approach is not an untested innovation extrapolated from a single case study (RECOVERY trial). Rather, it represents a return to the physician-led, real-world evidence model that operated successfully from 1883 to 1960 before being replaced by the current centralized system.
Cost structure comparison demonstrates dramatic efficiency difference:
- Pre-1962 system: $50M Numbers (1962) per drug (2024 inflation-adjusted) for safety testing; efficacy determined through decentralized physician case reports
- Post-1962 system: $2.60B per drug average, a 52× cost increase; drug companies conduct both safety and efficacy trials internally
- dFDA model: Return to decentralized physician-led efficacy testing with modern automation (electronic health records, AI-assisted analysis, real-time data aggregation), targeting 50-95% cost reductions
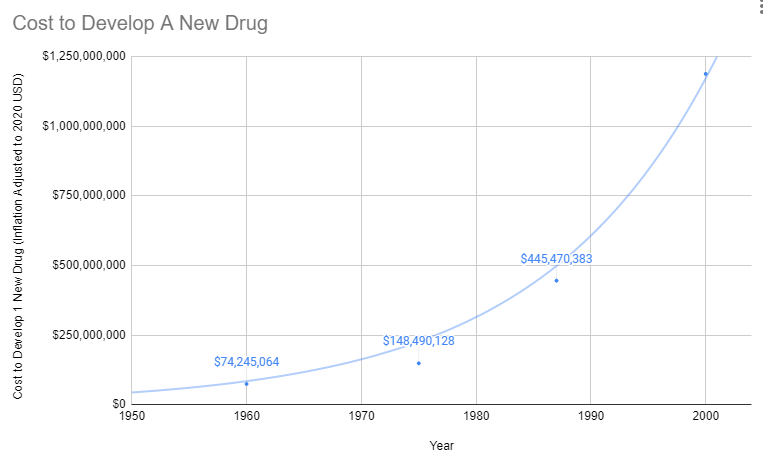
The cost explosion began exactly when efficacy testing was centralized within pharmaceutical companies. This wasn’t a natural evolution of drug development. It was a regulatory mandate that increased costs 52-fold while slowing innovation.
Historical operational model
From 1883 to 1960, 144k physicians across America tested drug efficacy on real patients in routine clinical practice. The Journal of the American Medical Association (JAMA) compiled these observational reports, leading medical experts peer-reviewed the aggregated data, and effective treatments received endorsement. This decentralized, pragmatic trial system coincided with dramatic improvements in life expectancy during the early-to-mid 20th century.
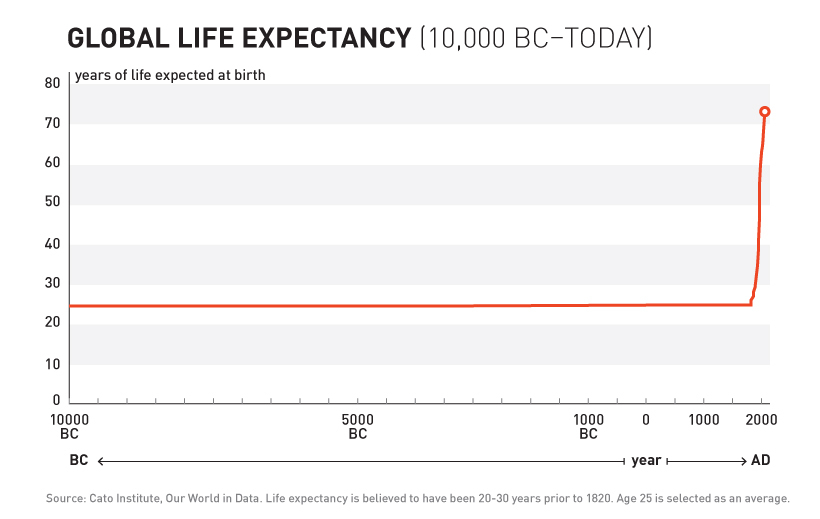
Human life expectancy remained essentially unchanged from the Bronze Age through 1883. Then something unprecedented happened: organized medical research began, physicians started systematically testing treatments, and life expectancy doubled within 77 years. This dramatic acceleration occurred under the decentralized physician-led model (1883-1960), not the centralized pharmaceutical trial system that replaced it after 1962.
Safety record, the thalidomide success story: Critically, the pre-1962 safety testing framework successfully prevented the thalidomide disaster that devastated Europe with thousands of horrific birth defects. When thalidomide was marketed in Europe starting in 1957 for morning sickness, existing FDA safety regulations (1938 Food, Drug, and Cosmetic Act) blocked the drug from approval in the United States. Zero American babies were harmed, the safety testing framework worked exactly as intended.
The 1962 Kefauver-Harris Amendment added extensive efficacy requirements in response to thalidomide, despite the fact that the US had already been fully protected by existing safety regulations. The problem was not insufficient regulation, safety testing had succeeded. The response was to take efficacy testing away from 144k independent physicians and centralize it within pharmaceutical companies, increasing costs 52-fold while slowing approvals substantially.
Current system deterioration: Life expectancy in the United States has declined in recent years (2014-2017, 2020-2021), the first sustained decreases since 1915-1918, suggesting the post-1962 regulatory model may have reached diminishing or negative returns.
Implications for generalizability
The RECOVERY trial ($500 Oren Cass (2023) per patient) demonstrates that modern infrastructure enables even greater efficiency than the pre-1962 system. However, the fundamental approach, physicians testing treatments on real patients in clinical practice settings, has 77 years of empirical validation (1883-1960), not merely one case study.
The cost reduction estimates (50-95%) are conservative relative to historical costs. 1980s drugs cost approximately $194M (compounded, 1990 dollars) compared to modern $2.60B costs, representing a 13.4-fold increase. Modern technology (EHRs, wearables, automated data collection) suggests efficiency gains could exceed historical precedent while maintaining the safety protections that successfully prevented disasters like thalidomide.
Political Feasibility Assumption
Assumption: The 1% Treaty achieves ratification by sufficient nations within a 3-5 year campaign timeline.
Justification: Historical treaty adoption timelines vary (Nuclear Non-Proliferation Treaty: 3 years; Paris Climate Agreement: 5 years). This analysis focuses on economic value conditional on implementation, not probability of political success.
Important caveat: This analysis does not model the probability distribution over political outcomes. The economic case (451:1 to 1.19M:1 ROI) holds if implemented, but political economy barriers to implementation are substantial and outside the scope of this cost-benefit analysis.
Expected Value Analysis Accounting for Political Risk
Standard economic practice: Cost-benefit analysis for interventions with implementation uncertainty requires expected value calculation:
\[E[ROI] = ROI_{conditional} \times P_{success}\]
The preceding analysis presents conditional benefits (returns IF implementation succeeds). Expected value analysis incorporates the probability of achieving political ratification and sustained commitment.
Political success probability: We model political success as uncertain, with a central estimate of 1% (ultra-conservative, assuming 99% failure rate) and an uncertainty range of 0.1%-10% reflecting geopolitical uncertainty. The distribution below shows the assumed probability range:
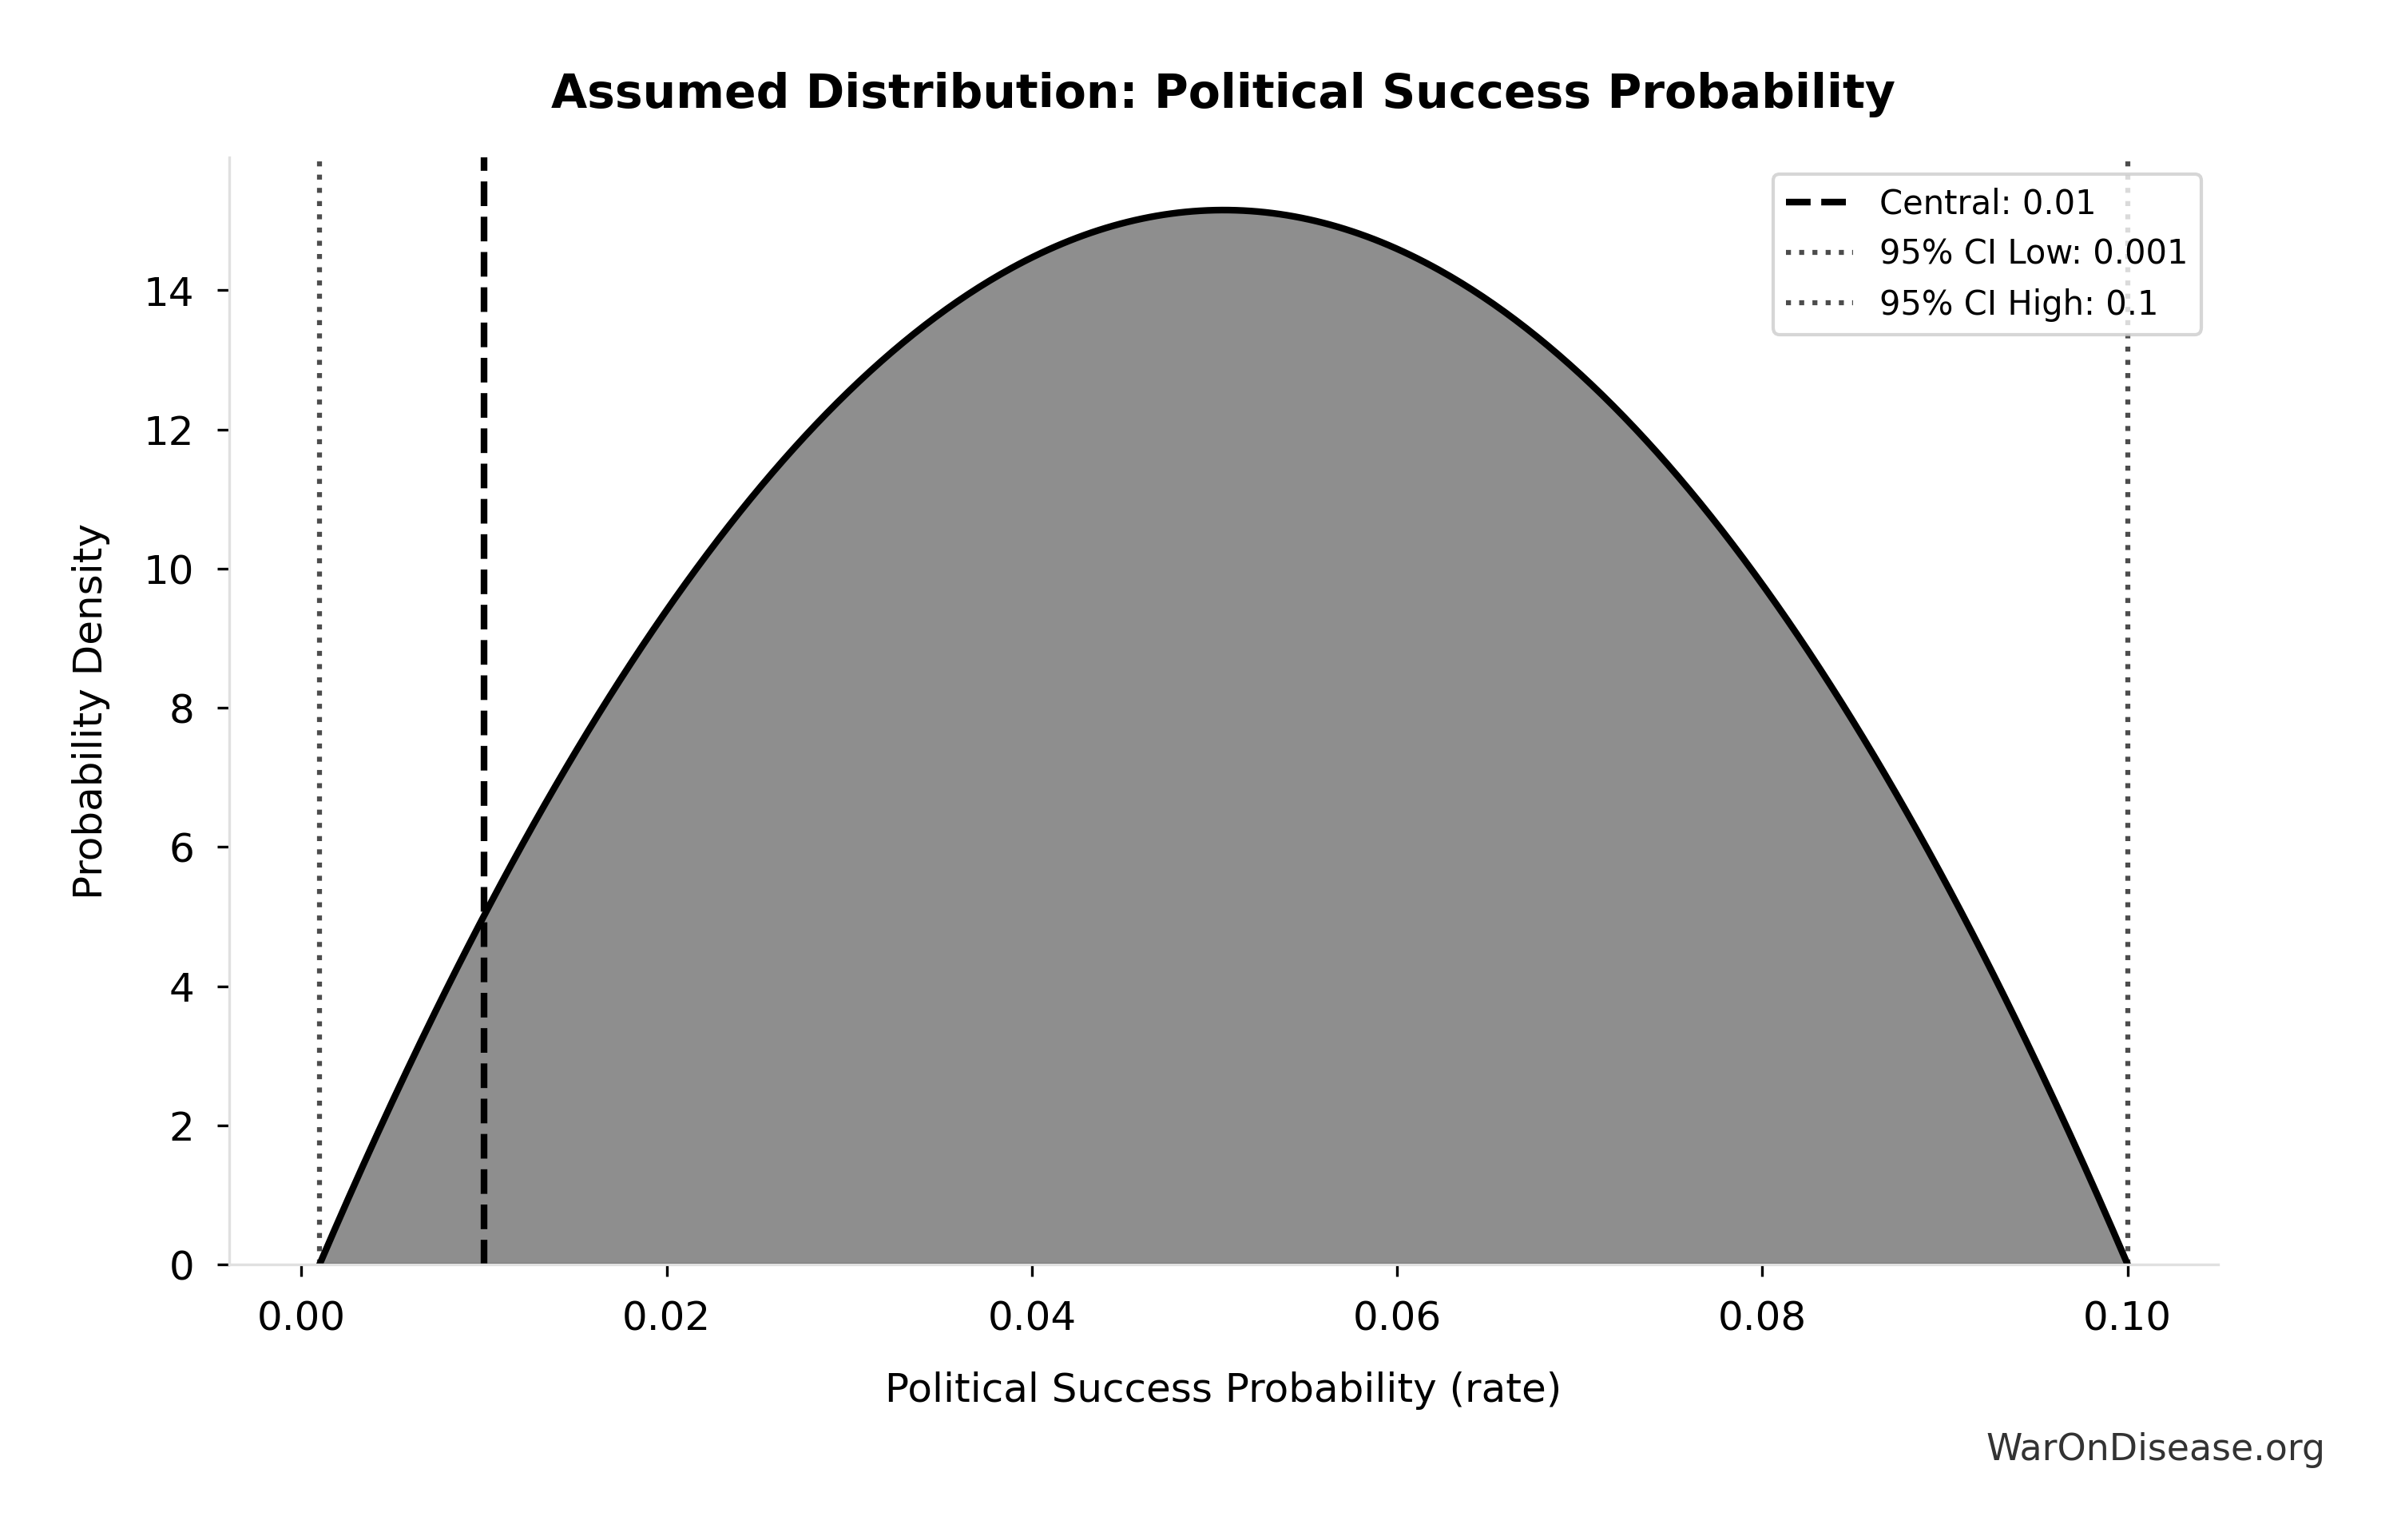
This chart shows the assumed probability distribution for this parameter. The shaded region represents the 95% confidence interval where we expect the true value to fall.
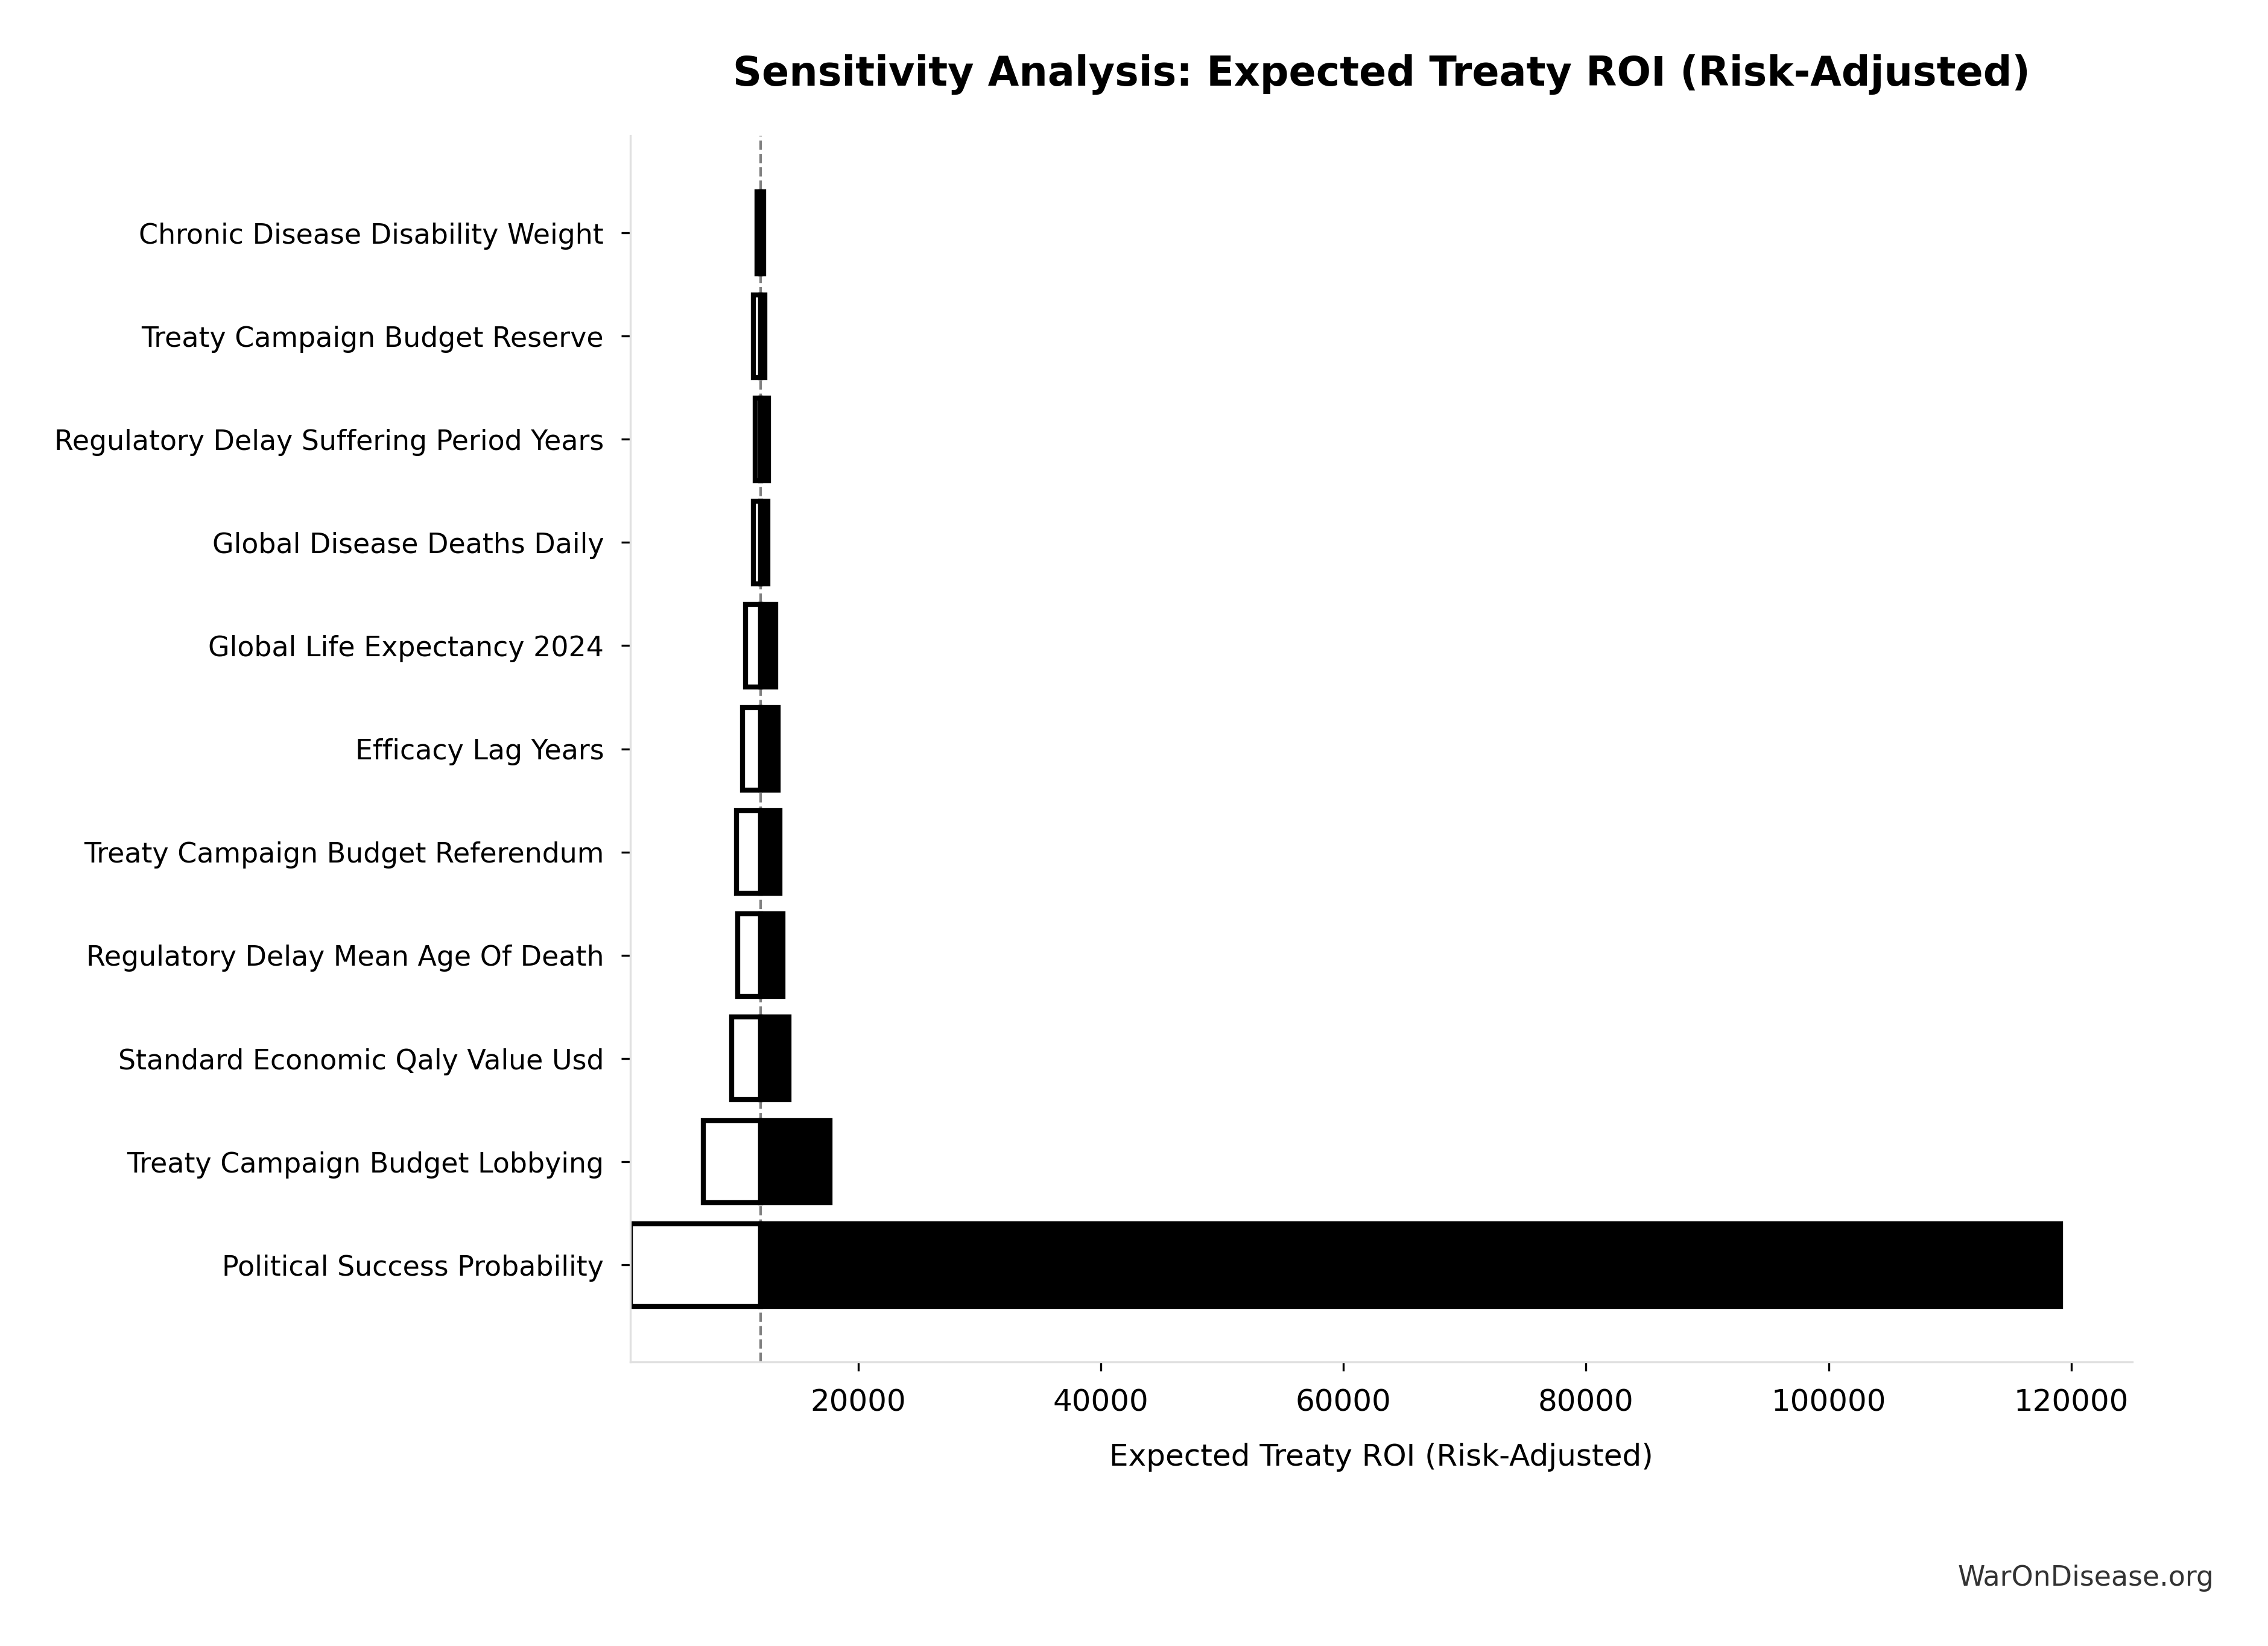
Risk-adjusted expected ROI: 11.9k:1
\[ E[ROI] = ROI_{conditional} \times P_{success} = ROI_{treaty} \times 0.01 \]
The tornado chart below shows how expected ROI varies with political success probability - this is the dominant driver of uncertainty:
The Monte Carlo distribution shows the full range of expected ROI outcomes when sampling political success probability from its uncertainty distribution:
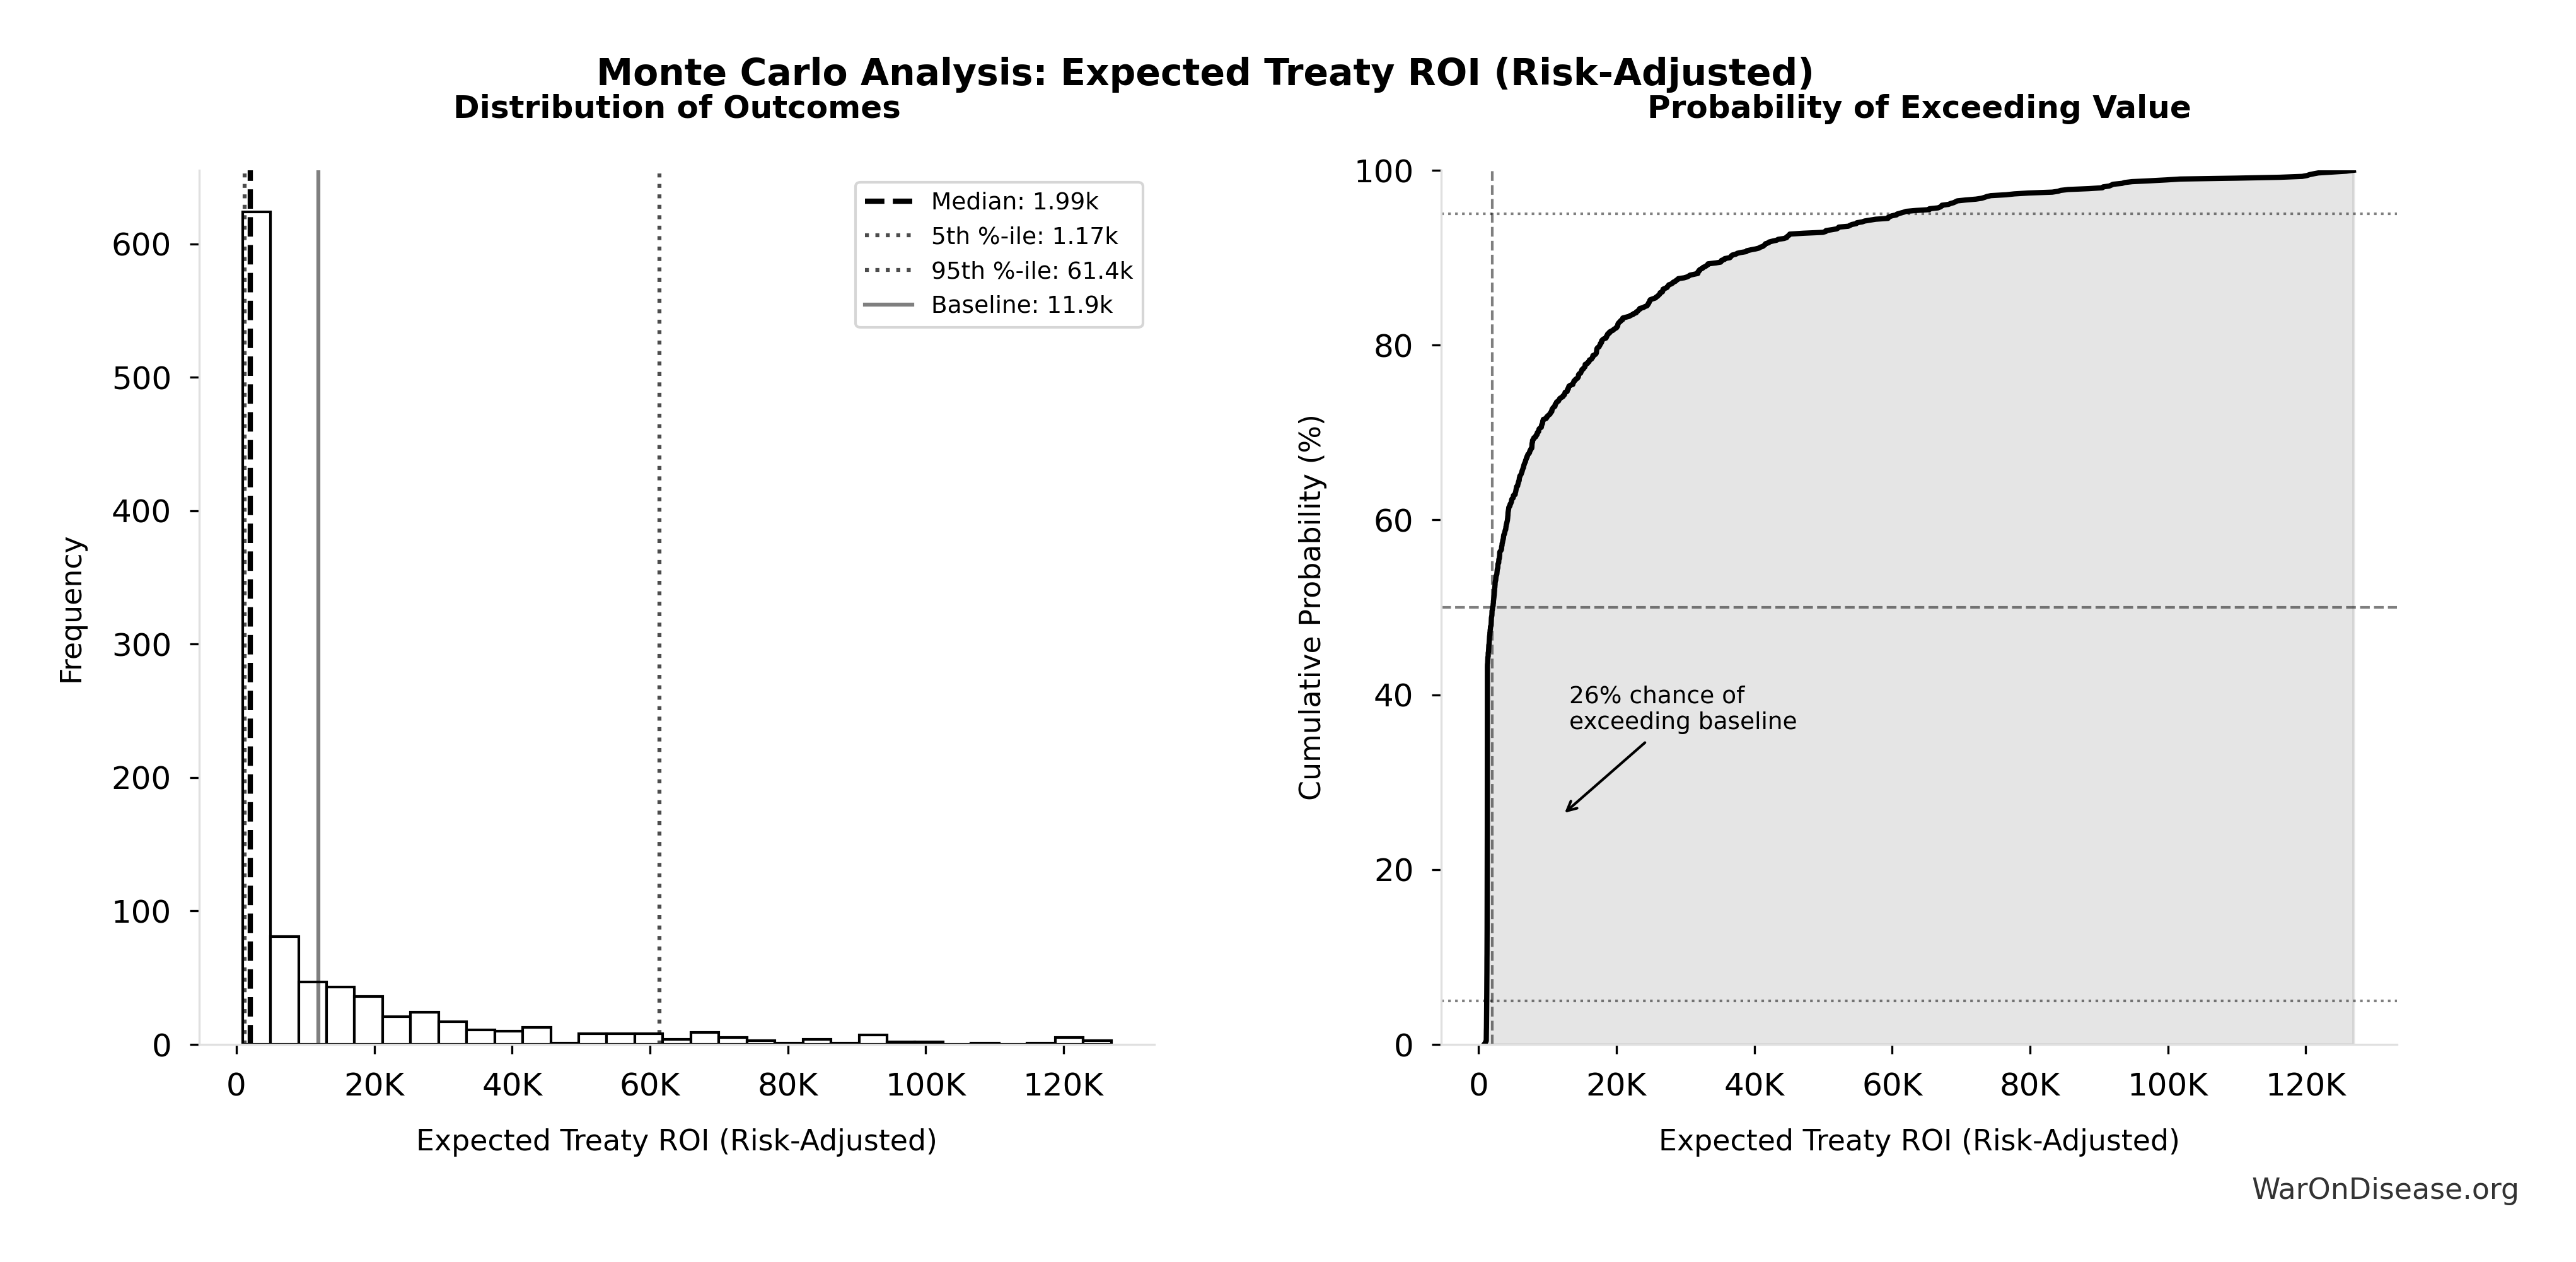
Simulation Results Summary: Expected Treaty ROI (Risk-Adjusted)
| Statistic | Value |
|---|---|
| Baseline (deterministic) | 11.9k |
| Mean (expected value) | 12.6k |
| Median (50th percentile) | 1.99k |
| Standard Deviation | 22.3k |
| 90% Confidence Interval | [1.17k, 61.4k] |
The histogram shows the distribution of Expected Treaty ROI (Risk-Adjusted) across 10,000 Monte Carlo simulations. The CDF (right) shows the probability of the outcome exceeding any given value, which is useful for risk assessment.
Key insight: Even at the 5th percentile (P≈0.1%), expected ROI substantially exceeds typical public health interventions (which have P≈1.0 but ROI of 10-30:1).
Comparison to traditional interventions (assuming 100% implementation probability):
- Childhood vaccination programs: 13 CDC (2017):1 ROI with P≈1.0
- Against Malaria Foundation: ~8:1 equivalent ROI
- 1% treaty (central estimate, P=1%): 11.9k:1 expected ROI
Interpretation: The high conditional ROI (1.19M:1) means that even modest implementation probabilities yield expected values competitive with best-in-class health interventions that have near-certain implementation.
Note: The uncertainty analysis samples political probability from a beta distribution with 5th percentile at 0.1% and 95th percentile at 10%. Actual probability depends on campaign execution, geopolitical conditions, and public support mobilization. The campaign strategy allocates $1B over 4 years specifically to maximize ratification probability.
Time Inconsistency and Commitment Credibility
Political economy challenge: Even if the treaty achieves initial ratification, sustained commitment over the 10-year analytical horizon faces time inconsistency problems. Political business cycles (2-6 year terms) create incentives to raid the pragmatic clinical trials budget for short-term priorities.
Concentrated costs, diffuse benefits: Defense contractors have concentrated interests with substantial lobbying capacity ($127M OpenSecrets (2024) annually). Health benefits, while larger in aggregate ($155B annually), are diffuse across millions of beneficiaries. Olson’s logic of collective action predicts that concentrated interests will resist more effectively than diffuse beneficiaries will mobilize, creating political economy barriers to sustained implementation.
Historical precedent: Post-WWII peace dividend: The post-World War II “peace dividend” saw military spending fall from 41% of GDP (1945) to 7.2% (1948), with expectations of permanent reductions. However, the Cold War reversed this within 3 years. Military spending returned to 15% of GDP by 1953. Similar patterns occurred post-Vietnam and post-Cold War: initial reductions followed by reversals within 5-10 years.
Treaty ratification ≠ sustained funding: The Paris Climate Agreement provides a cautionary example: 196 parties ratified, but many failed to meet funding commitments. As of 2024, developed countries have not met the $100B annual climate finance pledge despite treaty obligations. Treaty ratification creates moral commitment but weak enforcement mechanisms for sustained budgetary allocations.
Implication for expected value: The political success probabilities used in expected value analysis (10%-50%) implicitly incorporate time inconsistency risk. A treaty might ratify with P=50% but maintain funding for 10 years with P=25%. The expected value analysis partially addresses this through probability discounting, but time inconsistency (commitment erosion over time) represents an additional risk factor beyond initial political feasibility.
Potential commitment mechanisms (not modeled):
- Constitutional amendment (very high barrier, very high credibility)
- Independent funding agency with statutory protections
- Lock-box mechanism with supermajority requirement to redirect funds
- International monitoring and reputation costs
- Public transparency: all spending and trial outcomes publicly auditable
Note: The analysis acknowledges this limitation. Results should be interpreted as conditional on sustained implementation, with expected value analysis providing probability-adjusted estimates that partially account for political risk.
Technology Constancy Assumption
Assumption: Analysis does not incorporate potential advances in AI, automation, or biotechnology that could further accelerate research.
Justification: Conservative assumption. Emerging AI capabilities in drug discovery, automated synthesis, and computational biology could dramatically increase research productivity beyond modeled estimates.
Implication: Baseline estimates likely underestimate long-term benefits by excluding technology-driven accelerations.
Data Quality and Availability
All primary data sources are documented in References with confidence levels:
- High confidence (78%): SIPRI military expenditure, WHO mortality statistics, ClinicalTrials.gov data
- Medium confidence (17%): Peace dividend estimates, QALY valuations (wide range in literature)
- Conservative bounds: Where uncertainty exists, analysis uses conservative estimates favoring underestimation of benefits
For complete parameter documentation with confidence indicators and peer-review status, see Parameters and Calculations Reference.
Scenario Analysis: Conservative Case
451:1 ROI
This scenario includes only R&D efficiency savings, excluding peace dividends, earlier drug access, and other features.
ROI Derivation
Simple ROI calculation:
\[ ROI_{RD} = \frac{\$249.3B}{\$0.54B} \approx 463 \]
You spend $611M. You get back $275B over 10 years.
That’s $451 appearing for every $1 you invest. It’s like a money printer, except instead of causing inflation, it causes people to continue existing.
Technical note: This uses “net present value,” which is economist code for “future money is worth less than current money” (3% discount rate). The NPV calculation includes only annual recurring R&D savings over 10 years, not the one-time 8.2-year timeline shift in disease eradication (which is a separate benefit). If you’re into spreadsheets: full NPV methodology here.
Where the Money Comes From
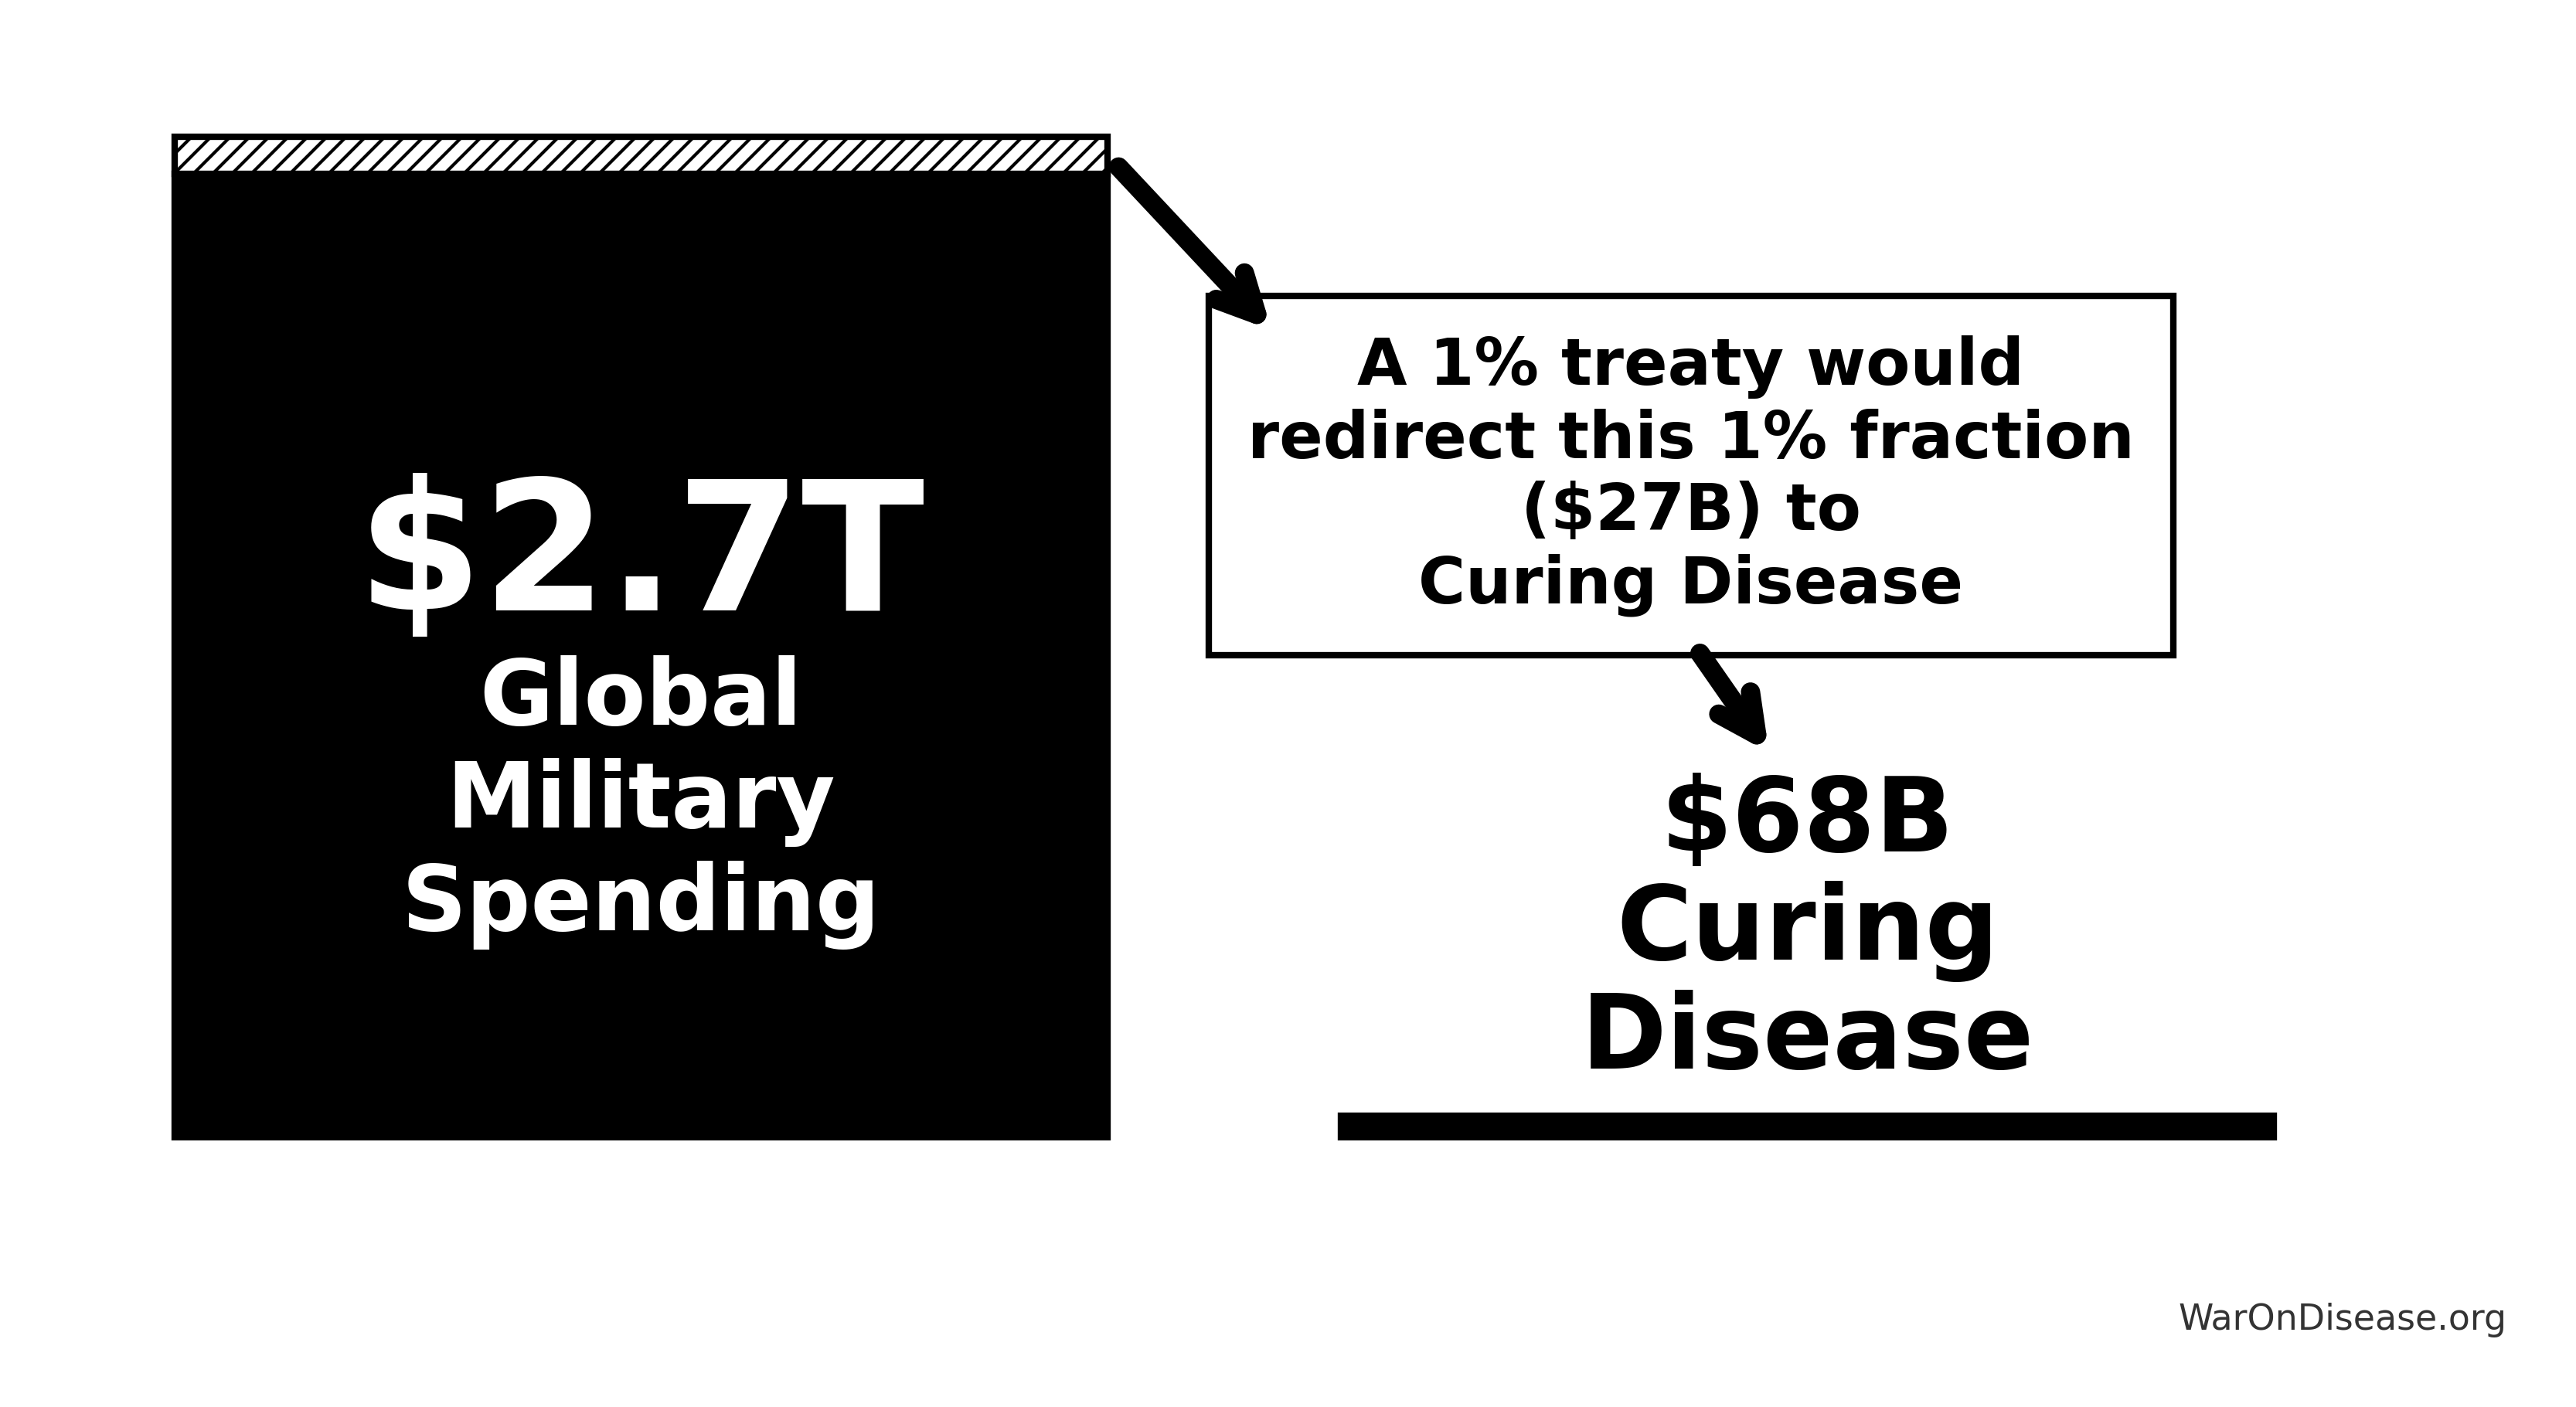
1% of global military budgets gets redirected. This gives you:
- Funding: $27B/year to spend on not-dying
- Bonus savings: $114B/year in economic value from building 1% fewer things that explode
The peace dividend math is simple: wars cost $11.4T/year. 1% less war costs 1% less money.
\[ Cost_{soc,ann} = Cost_{war,total} \times Reduction_{treaty} = \$11.36T \times 1.0\% = \$113.55B \]
| Cost Category | Annual Amount | Components |
|---|---|---|
| Direct Military Spending | $2.72T SIPRI (2025) | SIPRI 2024 global military budgets (source) |
| Infrastructure Destruction | Transportation, energy, communications, water, education, healthcare facilities | |
| Human Life Losses | 245k conflict deaths × $10M DOT (2024) value of statistical life (conservative estimate) | |
| Trade Disruption | Shipping, supply chains, energy prices, currency volatility | |
| Lost Economic Growth | $2.72T SIPRI (2016) | Opportunity cost of military spending vs. productive investment |
| Veteran Healthcare | $200B VA (2026) | Long-term medical care for conflict-related injuries |
| Refugee Support | $150B CGDev (2024) | 108.4M displaced persons × $1,384/year |
| Environmental Damage | $100B War | Environmental destruction, toxic contamination, restoration costs |
| Psychological Impact | $232B PubMed | PTSD treatment, mental health services, productivity loss |
| Lost Human Capital | $300B Numbers (2021) | Productive capacity lost from casualties and displacement |
| Total War Costs | $11.4T | Combined direct and indirect annual costs |
| 1% Reduction | $114B | Peace dividend from 1% treaty implementation |
This calculation methodology follows standard cost-of-conflict analysis frameworks used by the World Bank, IMF, and academic conflict economics research. See Peace Dividend Calculations for detailed sources and methodology.
Note on confidence levels: The direct military spending reduction ($27.2B) has high confidence. The remaining conflict cost reductions assume proportional scaling (1% military spending → 1% conflict reduction) which lacks empirical validation. Conservative scenarios should use only direct fiscal savings; optimistic scenarios can include full peace dividend effects.
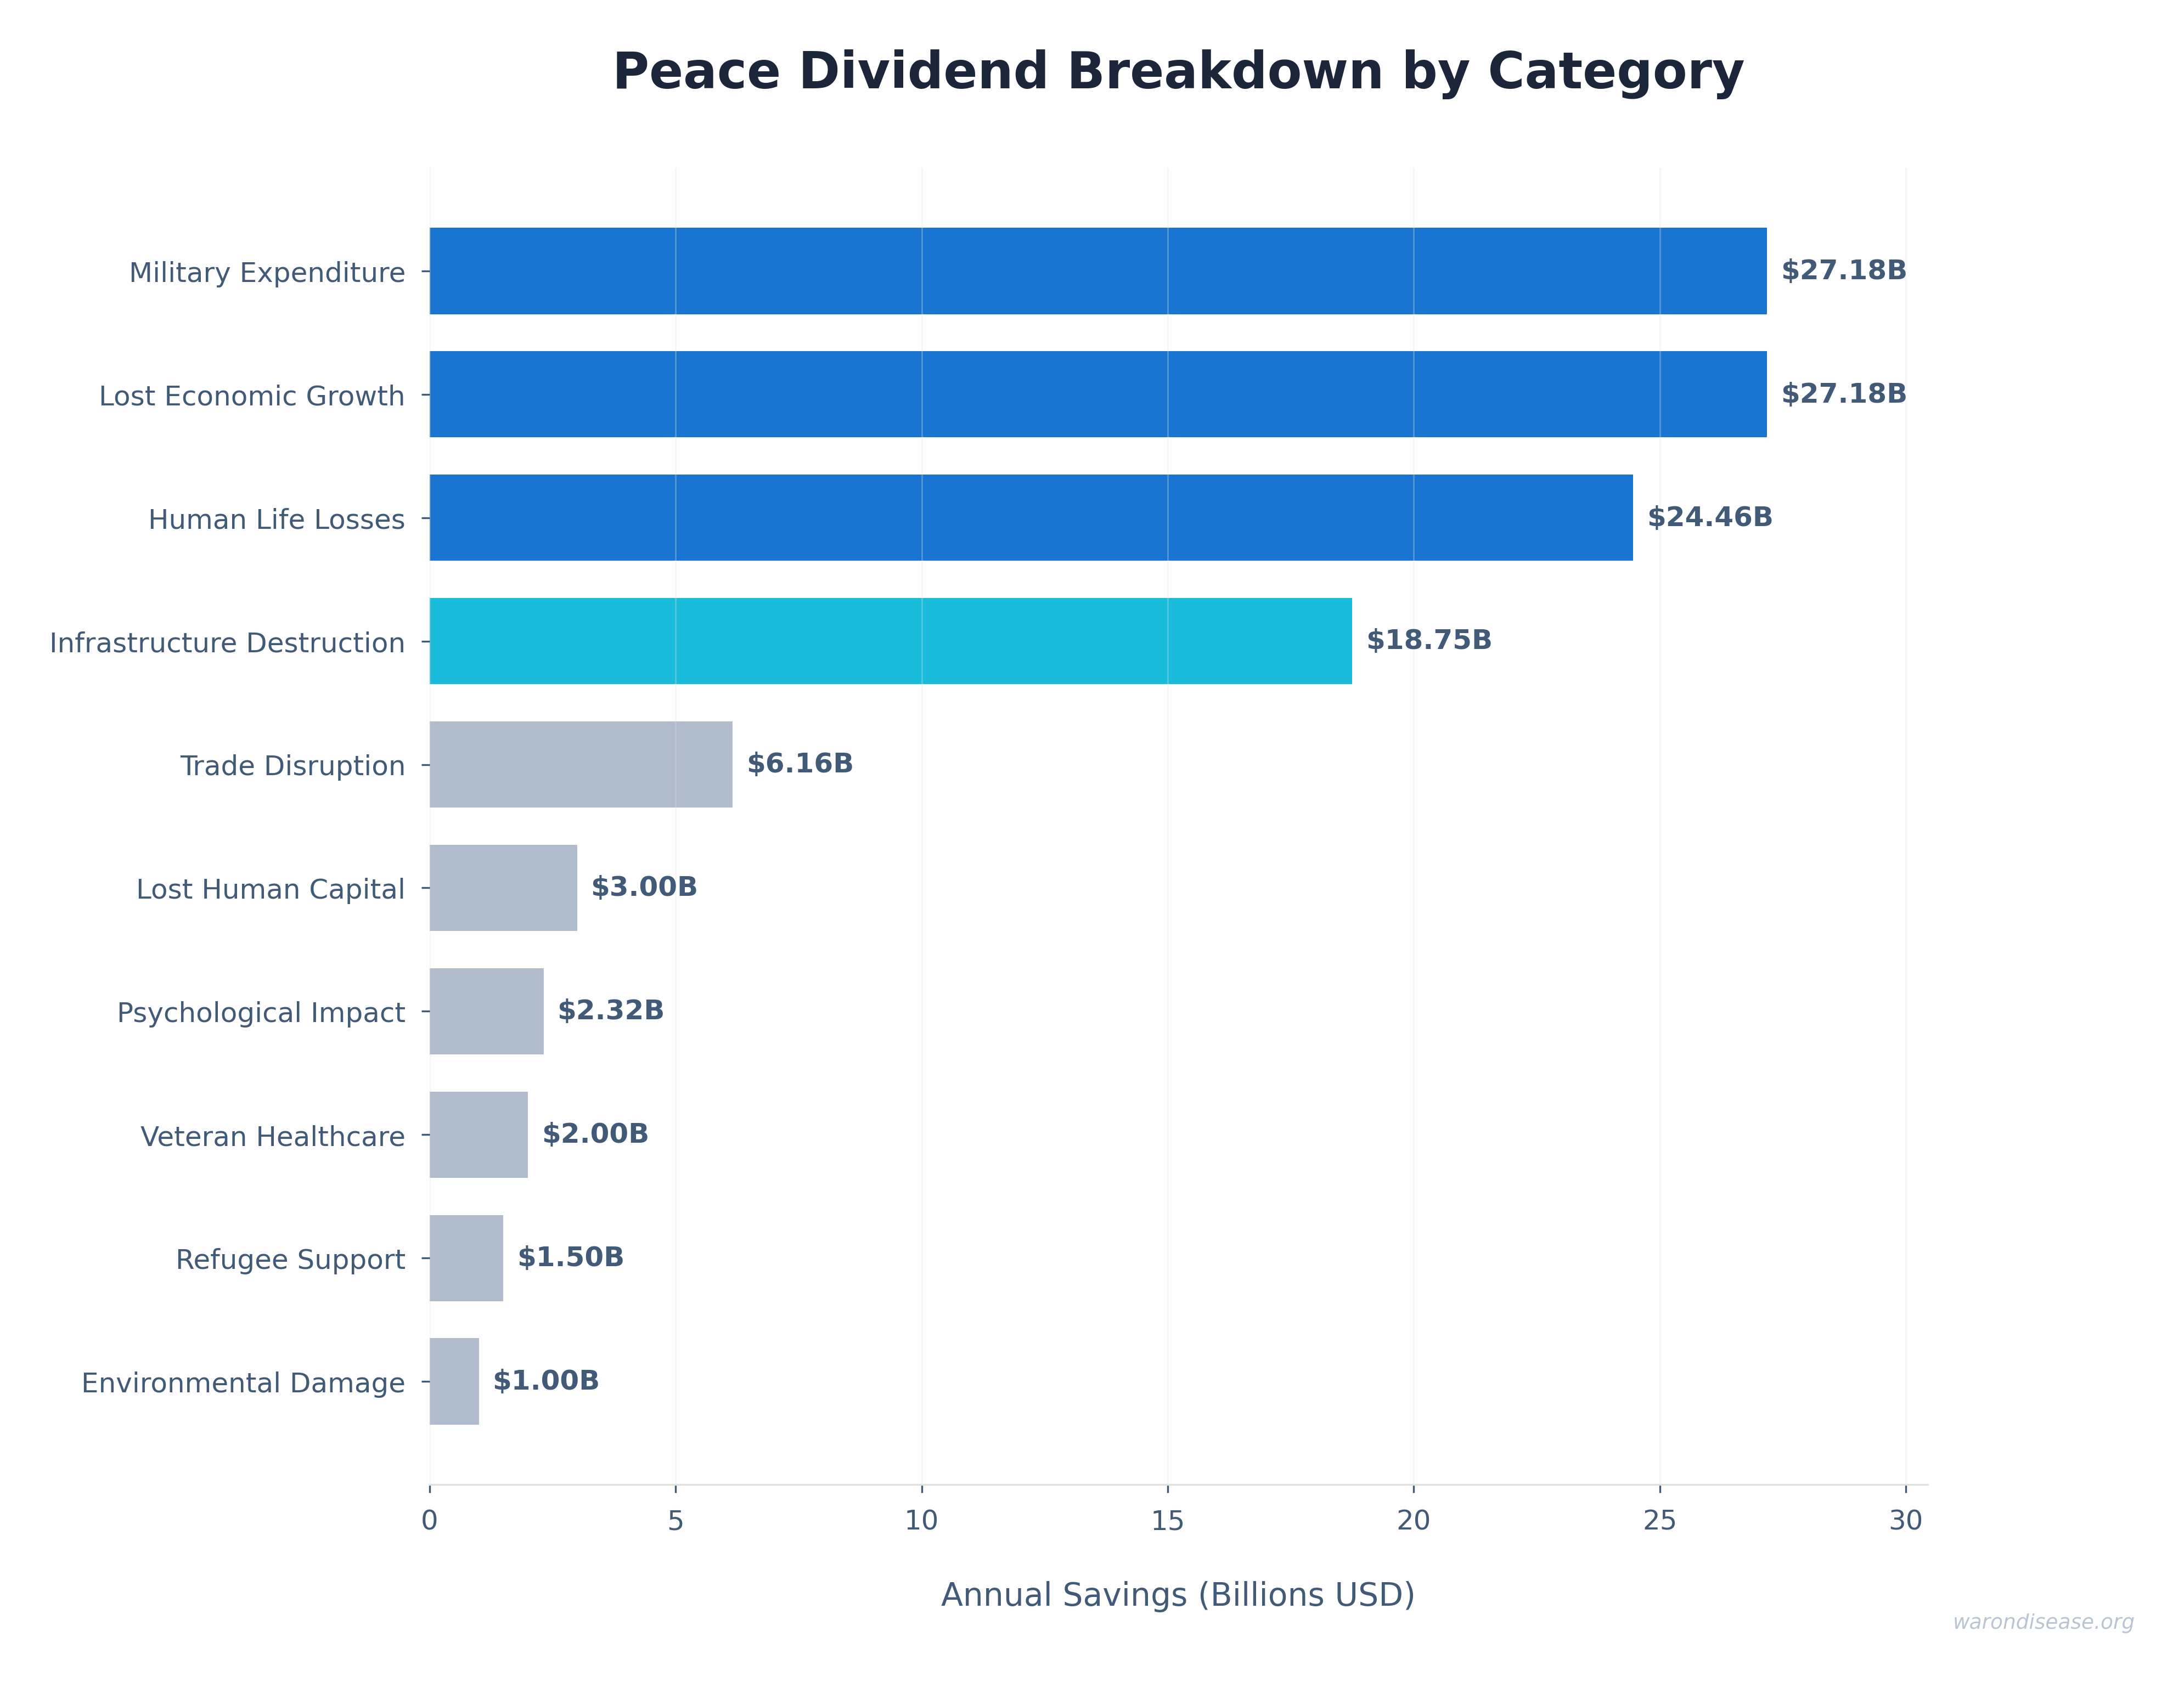
Sensitivity of peace dividend estimate: The tornado chart below shows which cost components have the largest impact on the total peace dividend. The dominant drivers are infrastructure destruction costs and lost economic growth:
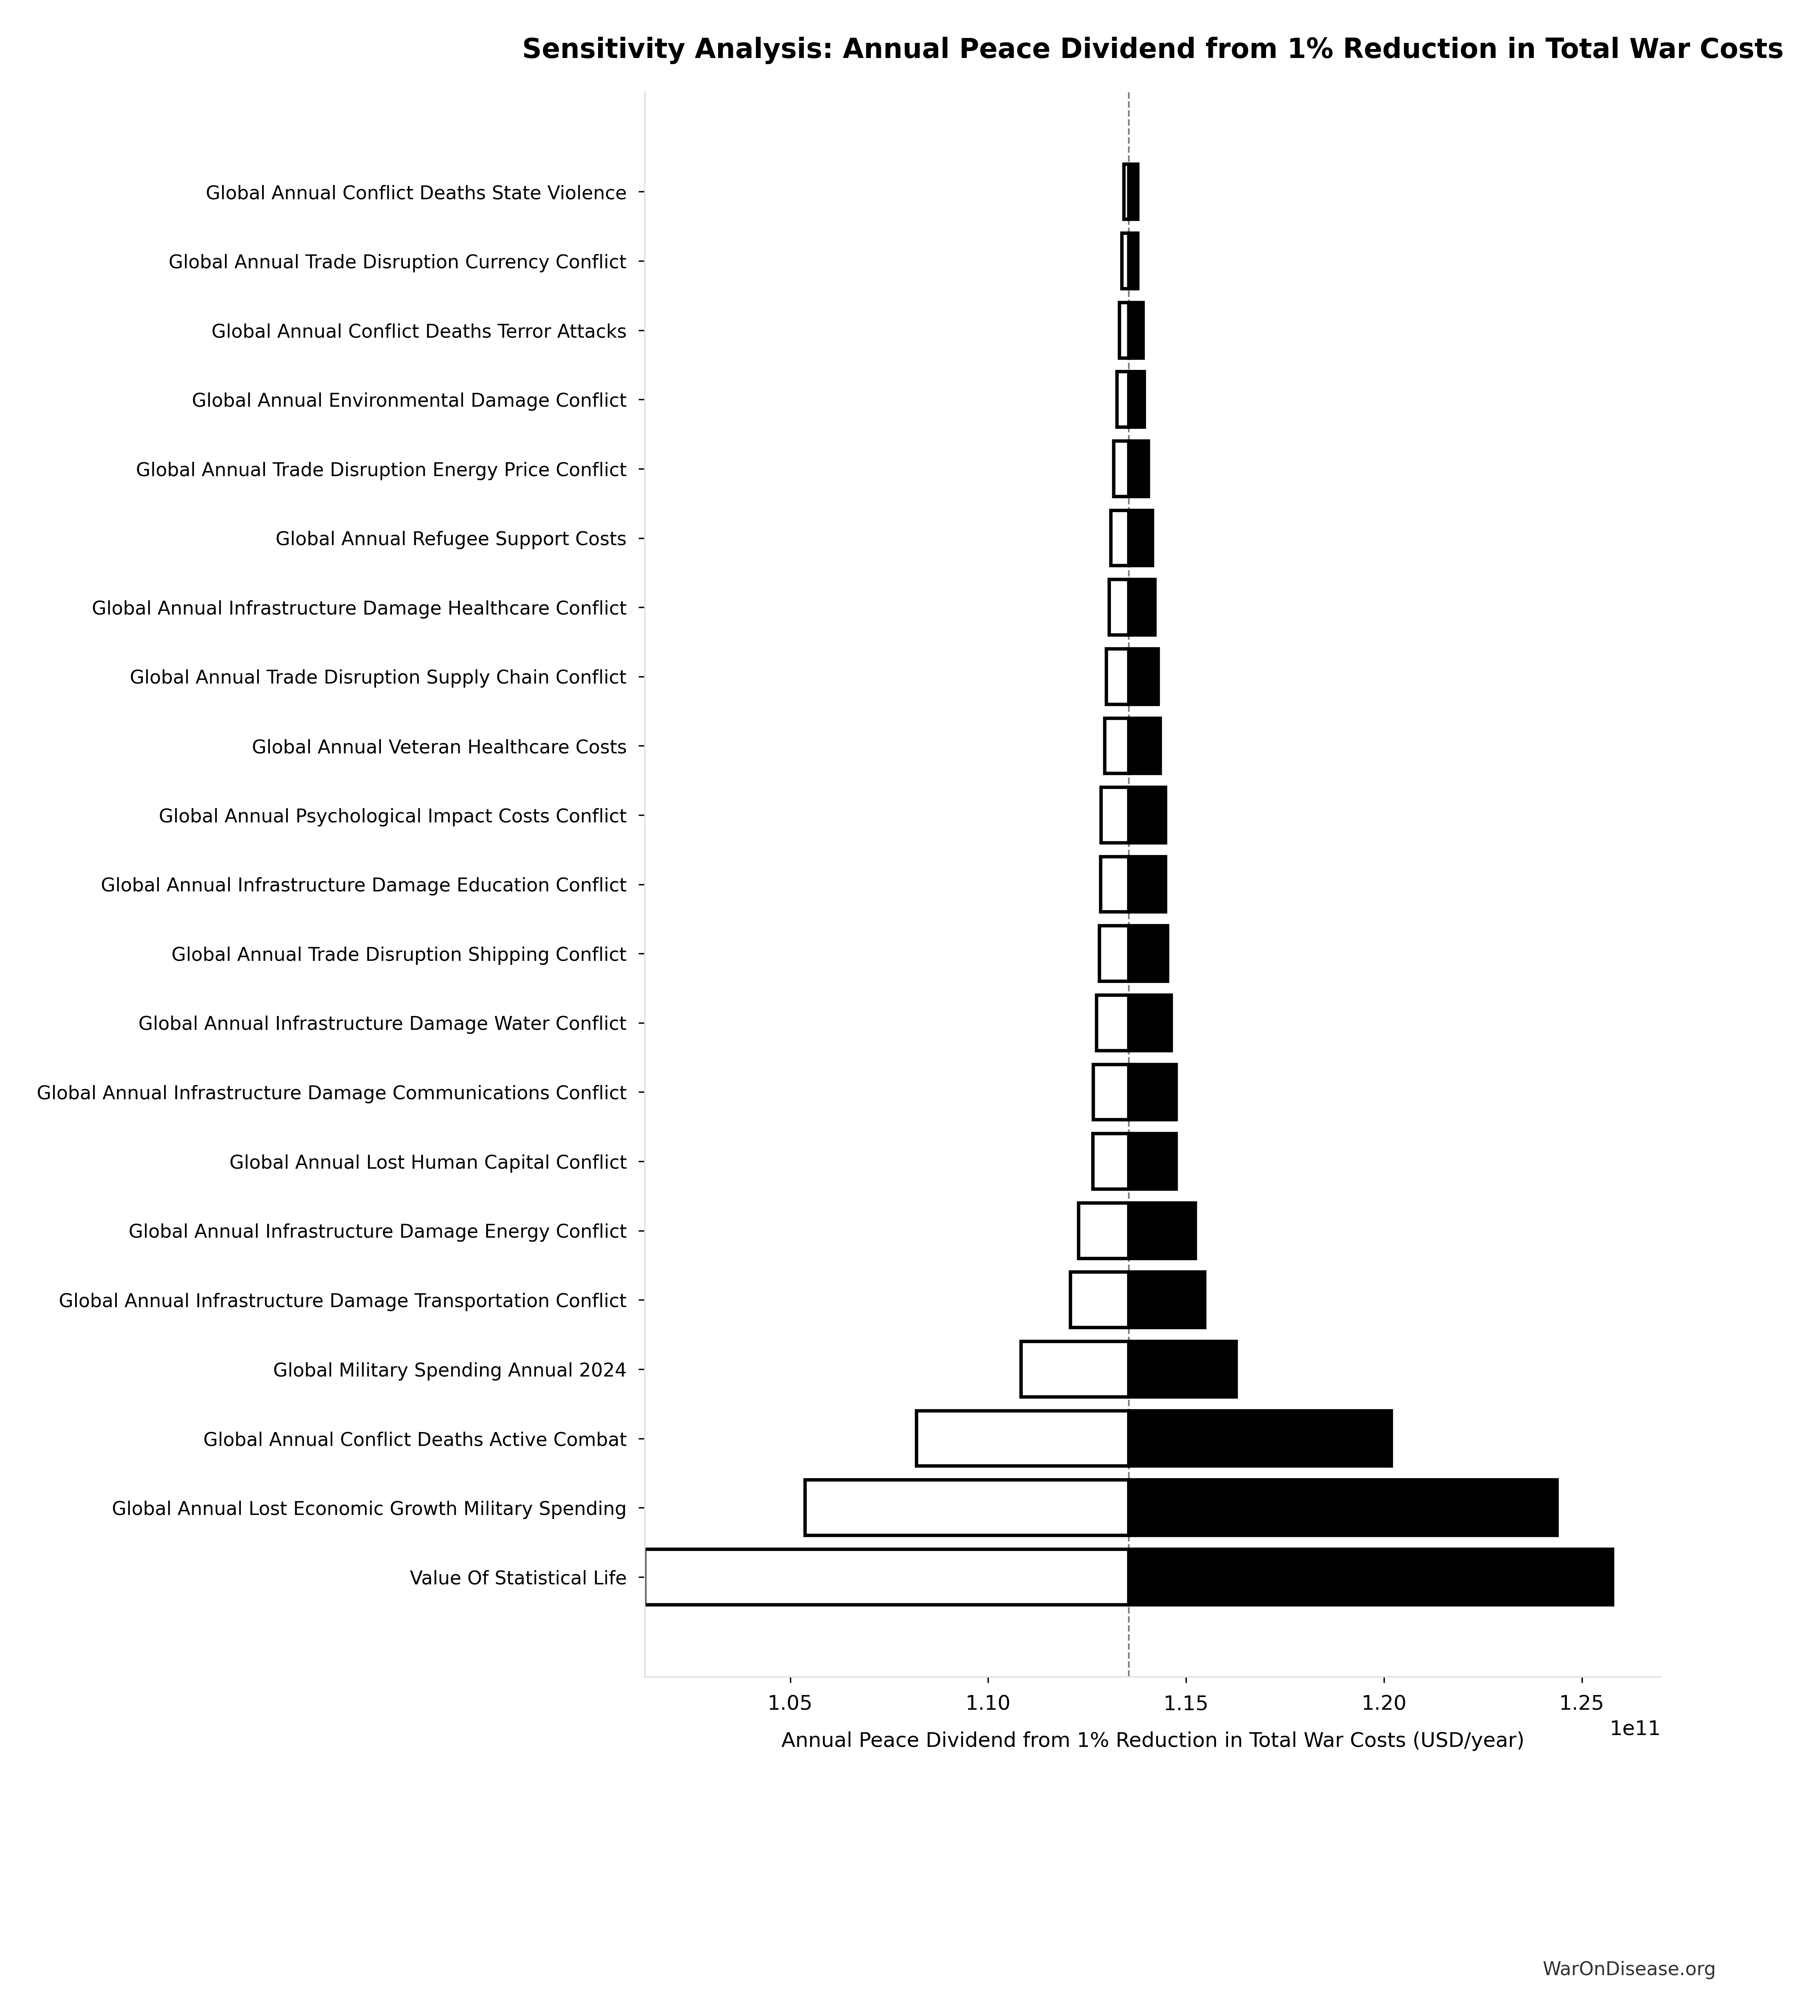
How Treaty Funding Is Allocated
Total annual treaty funding: $27.2B
The funding uses an 80/10/10 automatic allocation:
| Allocation | Percentage | Annual Amount | Purpose |
|---|---|---|---|
| Pragmatic Clinical Trials | Patient subsidies, dFDA platform | ||
| VICTORY IAB Investor Returns | 10% |
$2.72B |
Perpetual investor payments |
| IAB Political Incentives | 10% |
Rewards for supporting legislators |
Within the 80% allocated to pragmatic clinical trials:
- Patient Trial Subsidies (79.9%): $21.7B/year
- Coordination Platform (0.147%): $40M/year for dFDA infrastructure
Why costs are low: A dFDA provides coordination protocols (like HTTP for the internet), not a competing platform.
The infrastructure already exists. Epic, Cerner, Medable, Science 37 have built the components. The dFDA creates the coordination layer that makes them work together for clinical trials.
Data stays federated (in Epic/Cerner/Apple Health systems). No massive centralized database. No billion-dollar infrastructure. Just coordination protocols.
For detailed cost breakdown: Platform Costs.
Key insight: 80% of treaty funding goes directly to pragmatic clinical trials (patients and providers as trial participation subsidies). Framework overhead is minimal ($40M) compared to patient subsidies ($21.7B).
This assumes gradual rollout (0% to 100% adoption over 5 years). Full breakdown: dFDA Cost-Benefit Analysis.
What You Get Back
- Money: $275B in R&D savings (10 years)
- Returns: $275B ÷ $611M = 451:1 (full analysis)
- Not dying: 7.94B quality-adjusted life years annually
Two money fountains from one budget shift:
- Peace dividend: $114B/year (from building 1% fewer things that explode)
- Research efficiency: $41.5B/year (from not requiring PhDs to document paperwork about paperwork for 17 Drugs.com years)
Combined: $155B/year
Uncertainty Analysis: Combined Annual Benefits
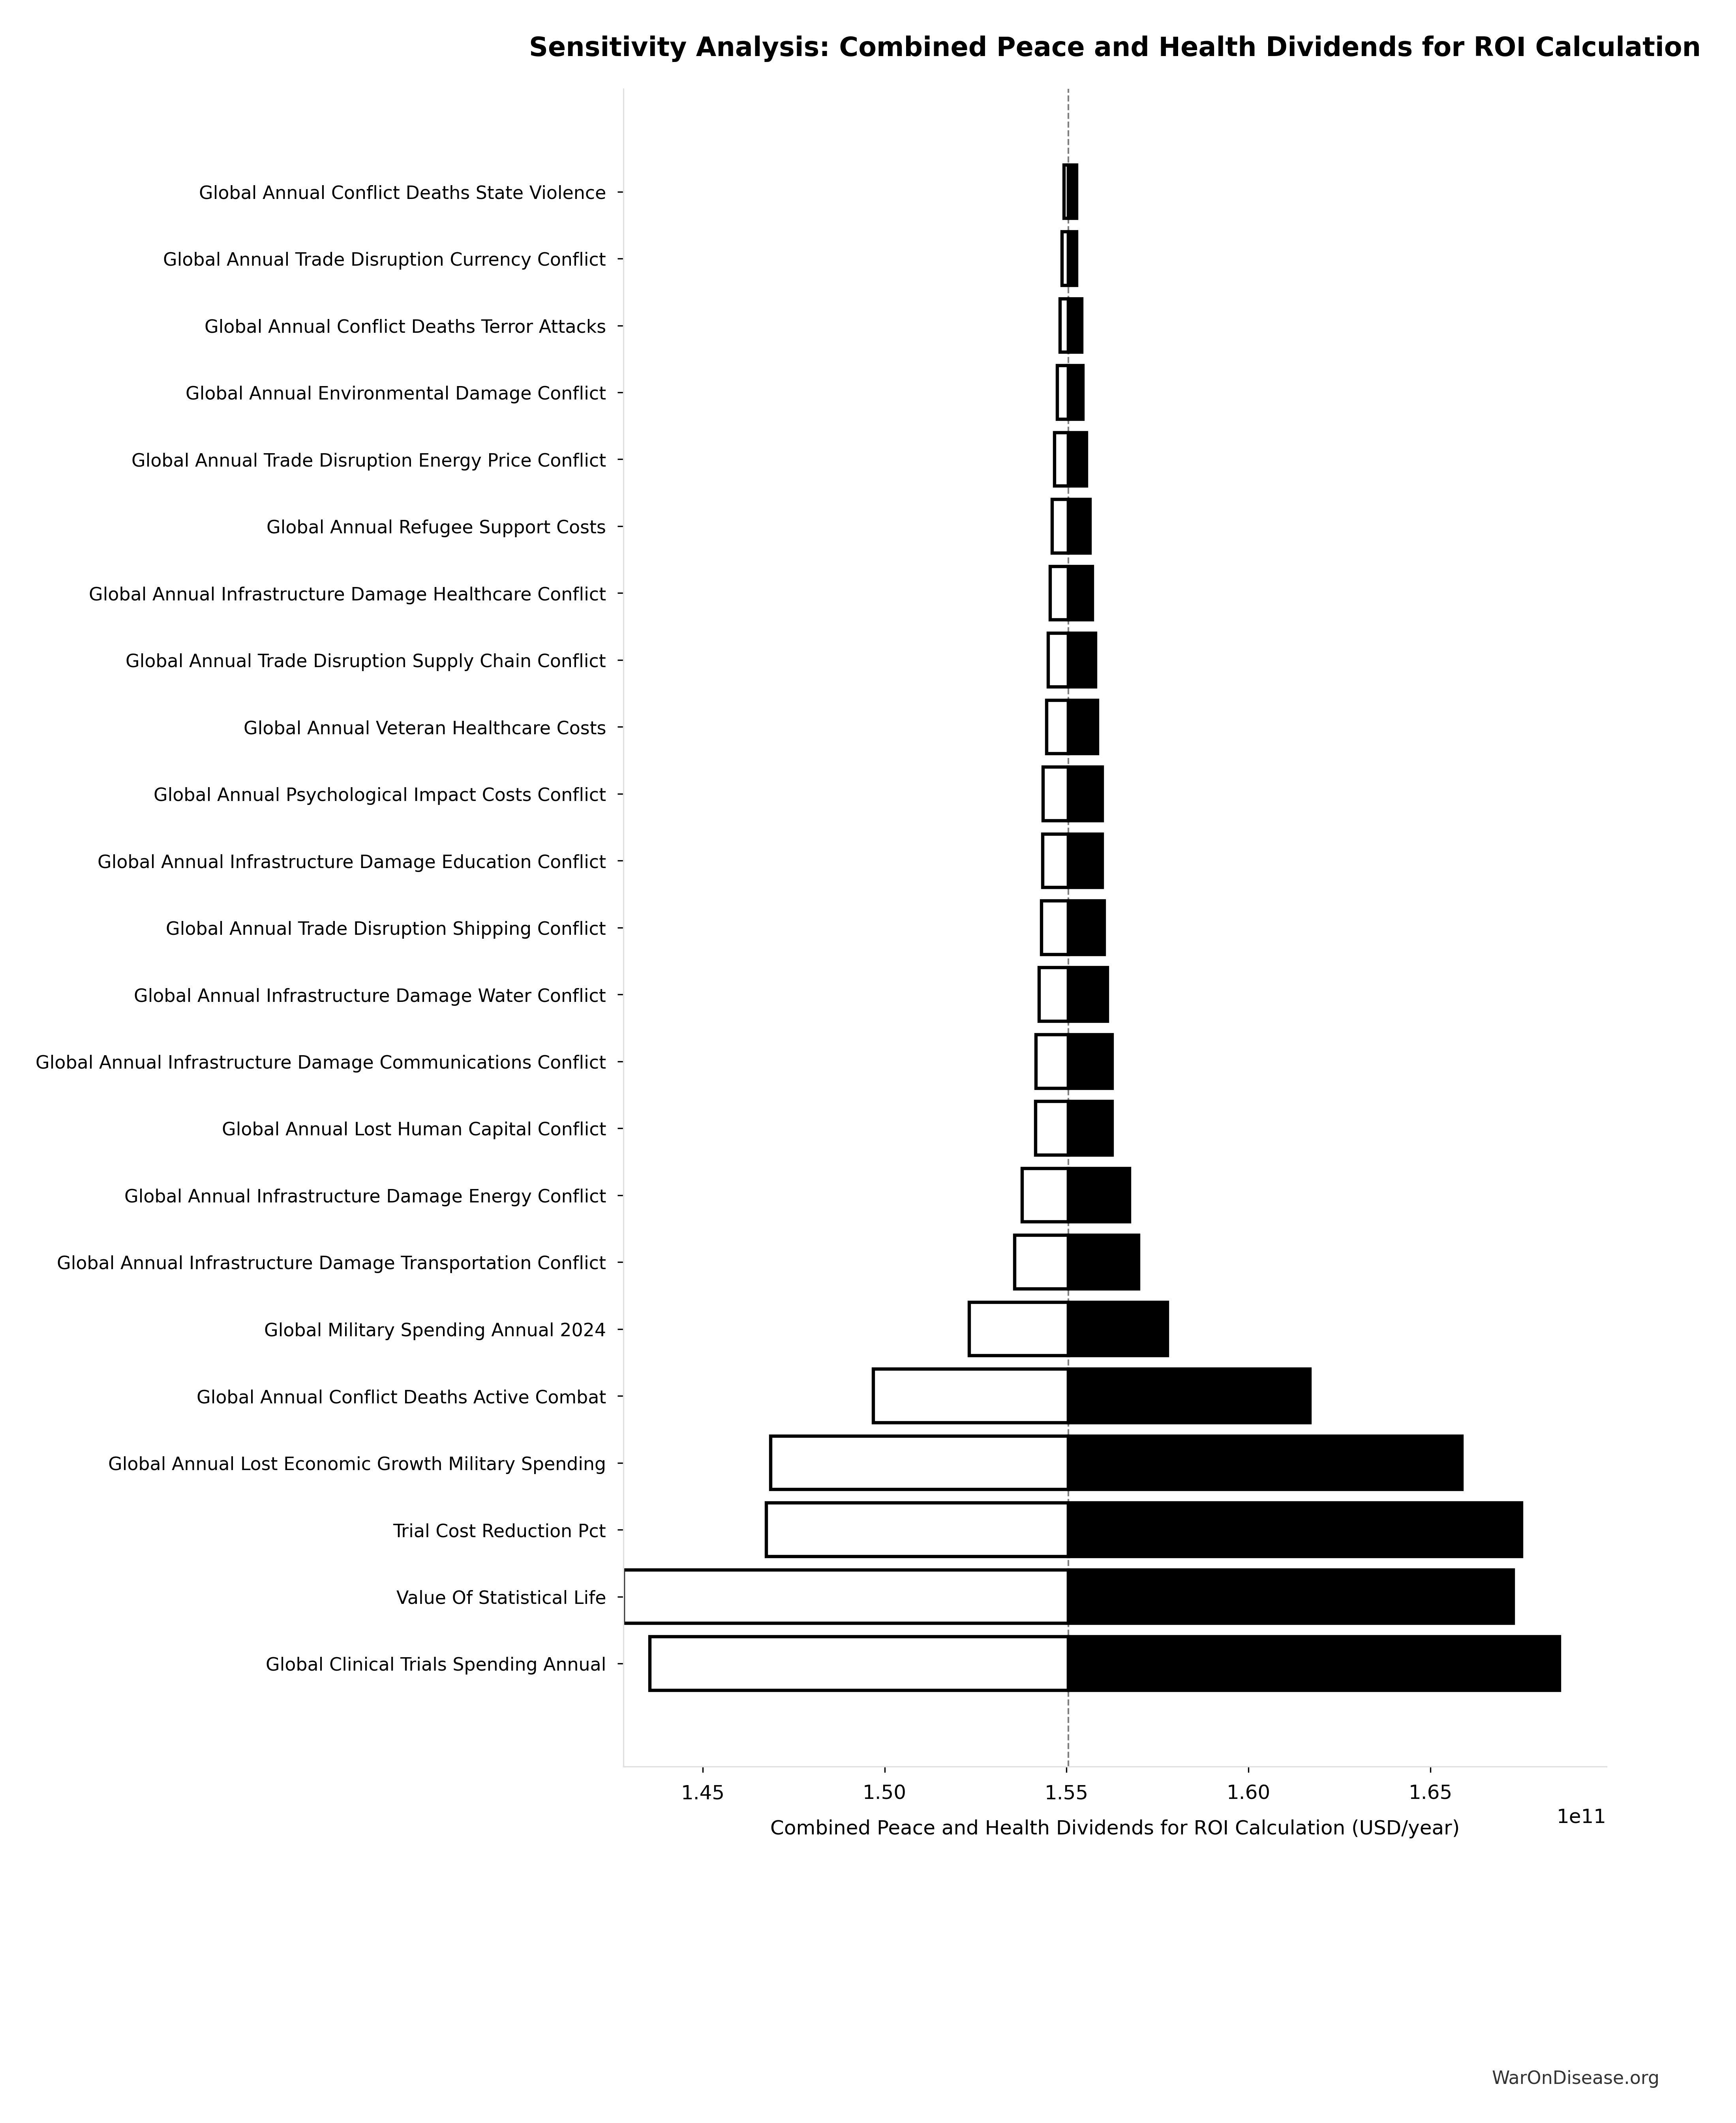
The tornado diagram shows that peace dividend magnitude and R&D savings dominate the uncertainty in combined annual benefits. Both funding streams contribute substantially to the total.
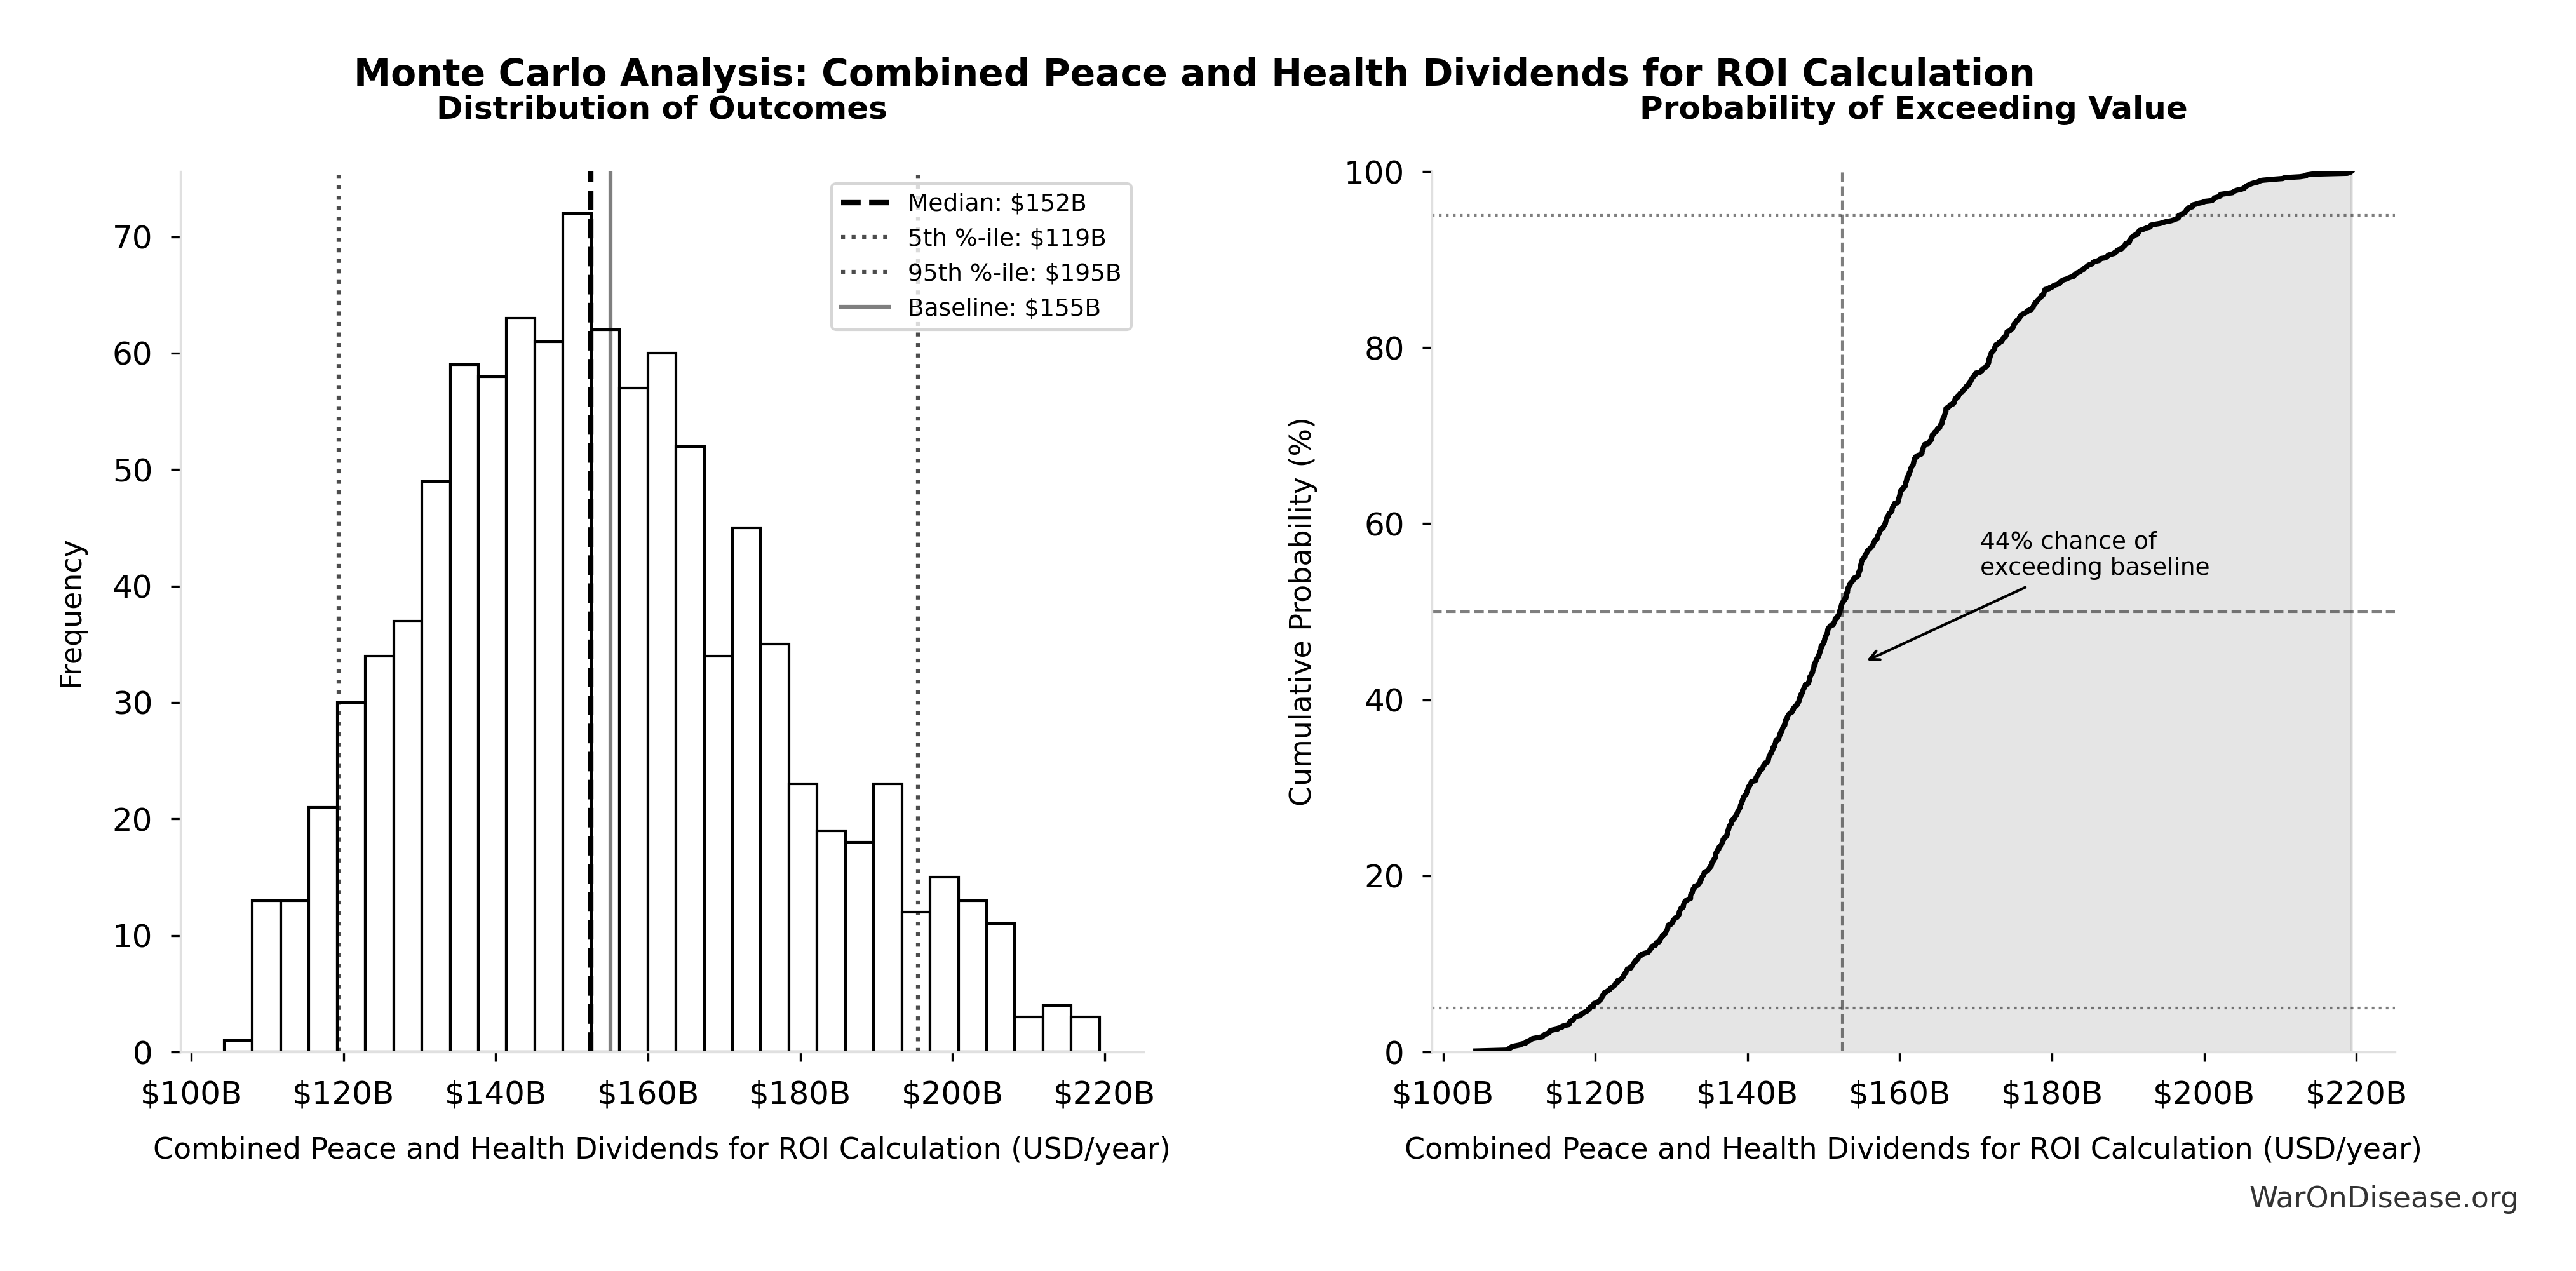
Simulation Results Summary: Combined Peace and Health Dividends for ROI Calculation
| Statistic | Value |
|---|---|
| Baseline (deterministic) | $155B |
| Mean (expected value) | $154B |
| Median (50th percentile) | $152B |
| Standard Deviation | $23.1B |
| 90% Confidence Interval | [$119B, $195B] |
The histogram shows the distribution of Combined Peace and Health Dividends for ROI Calculation across 10,000 Monte Carlo simulations. The CDF (right) shows the probability of the outcome exceeding any given value, which is useful for risk assessment.
Monte Carlo simulation across 10,000 trials confirms robustness: the 95% confidence interval for combined annual benefits demonstrates that the intervention generates tens of billions in recurring value annually across all plausible scenarios.
The conservative case excludes faster drug access, better treatment selection, reduced adverse events, and the eight additional benefits quantified in the complete case.
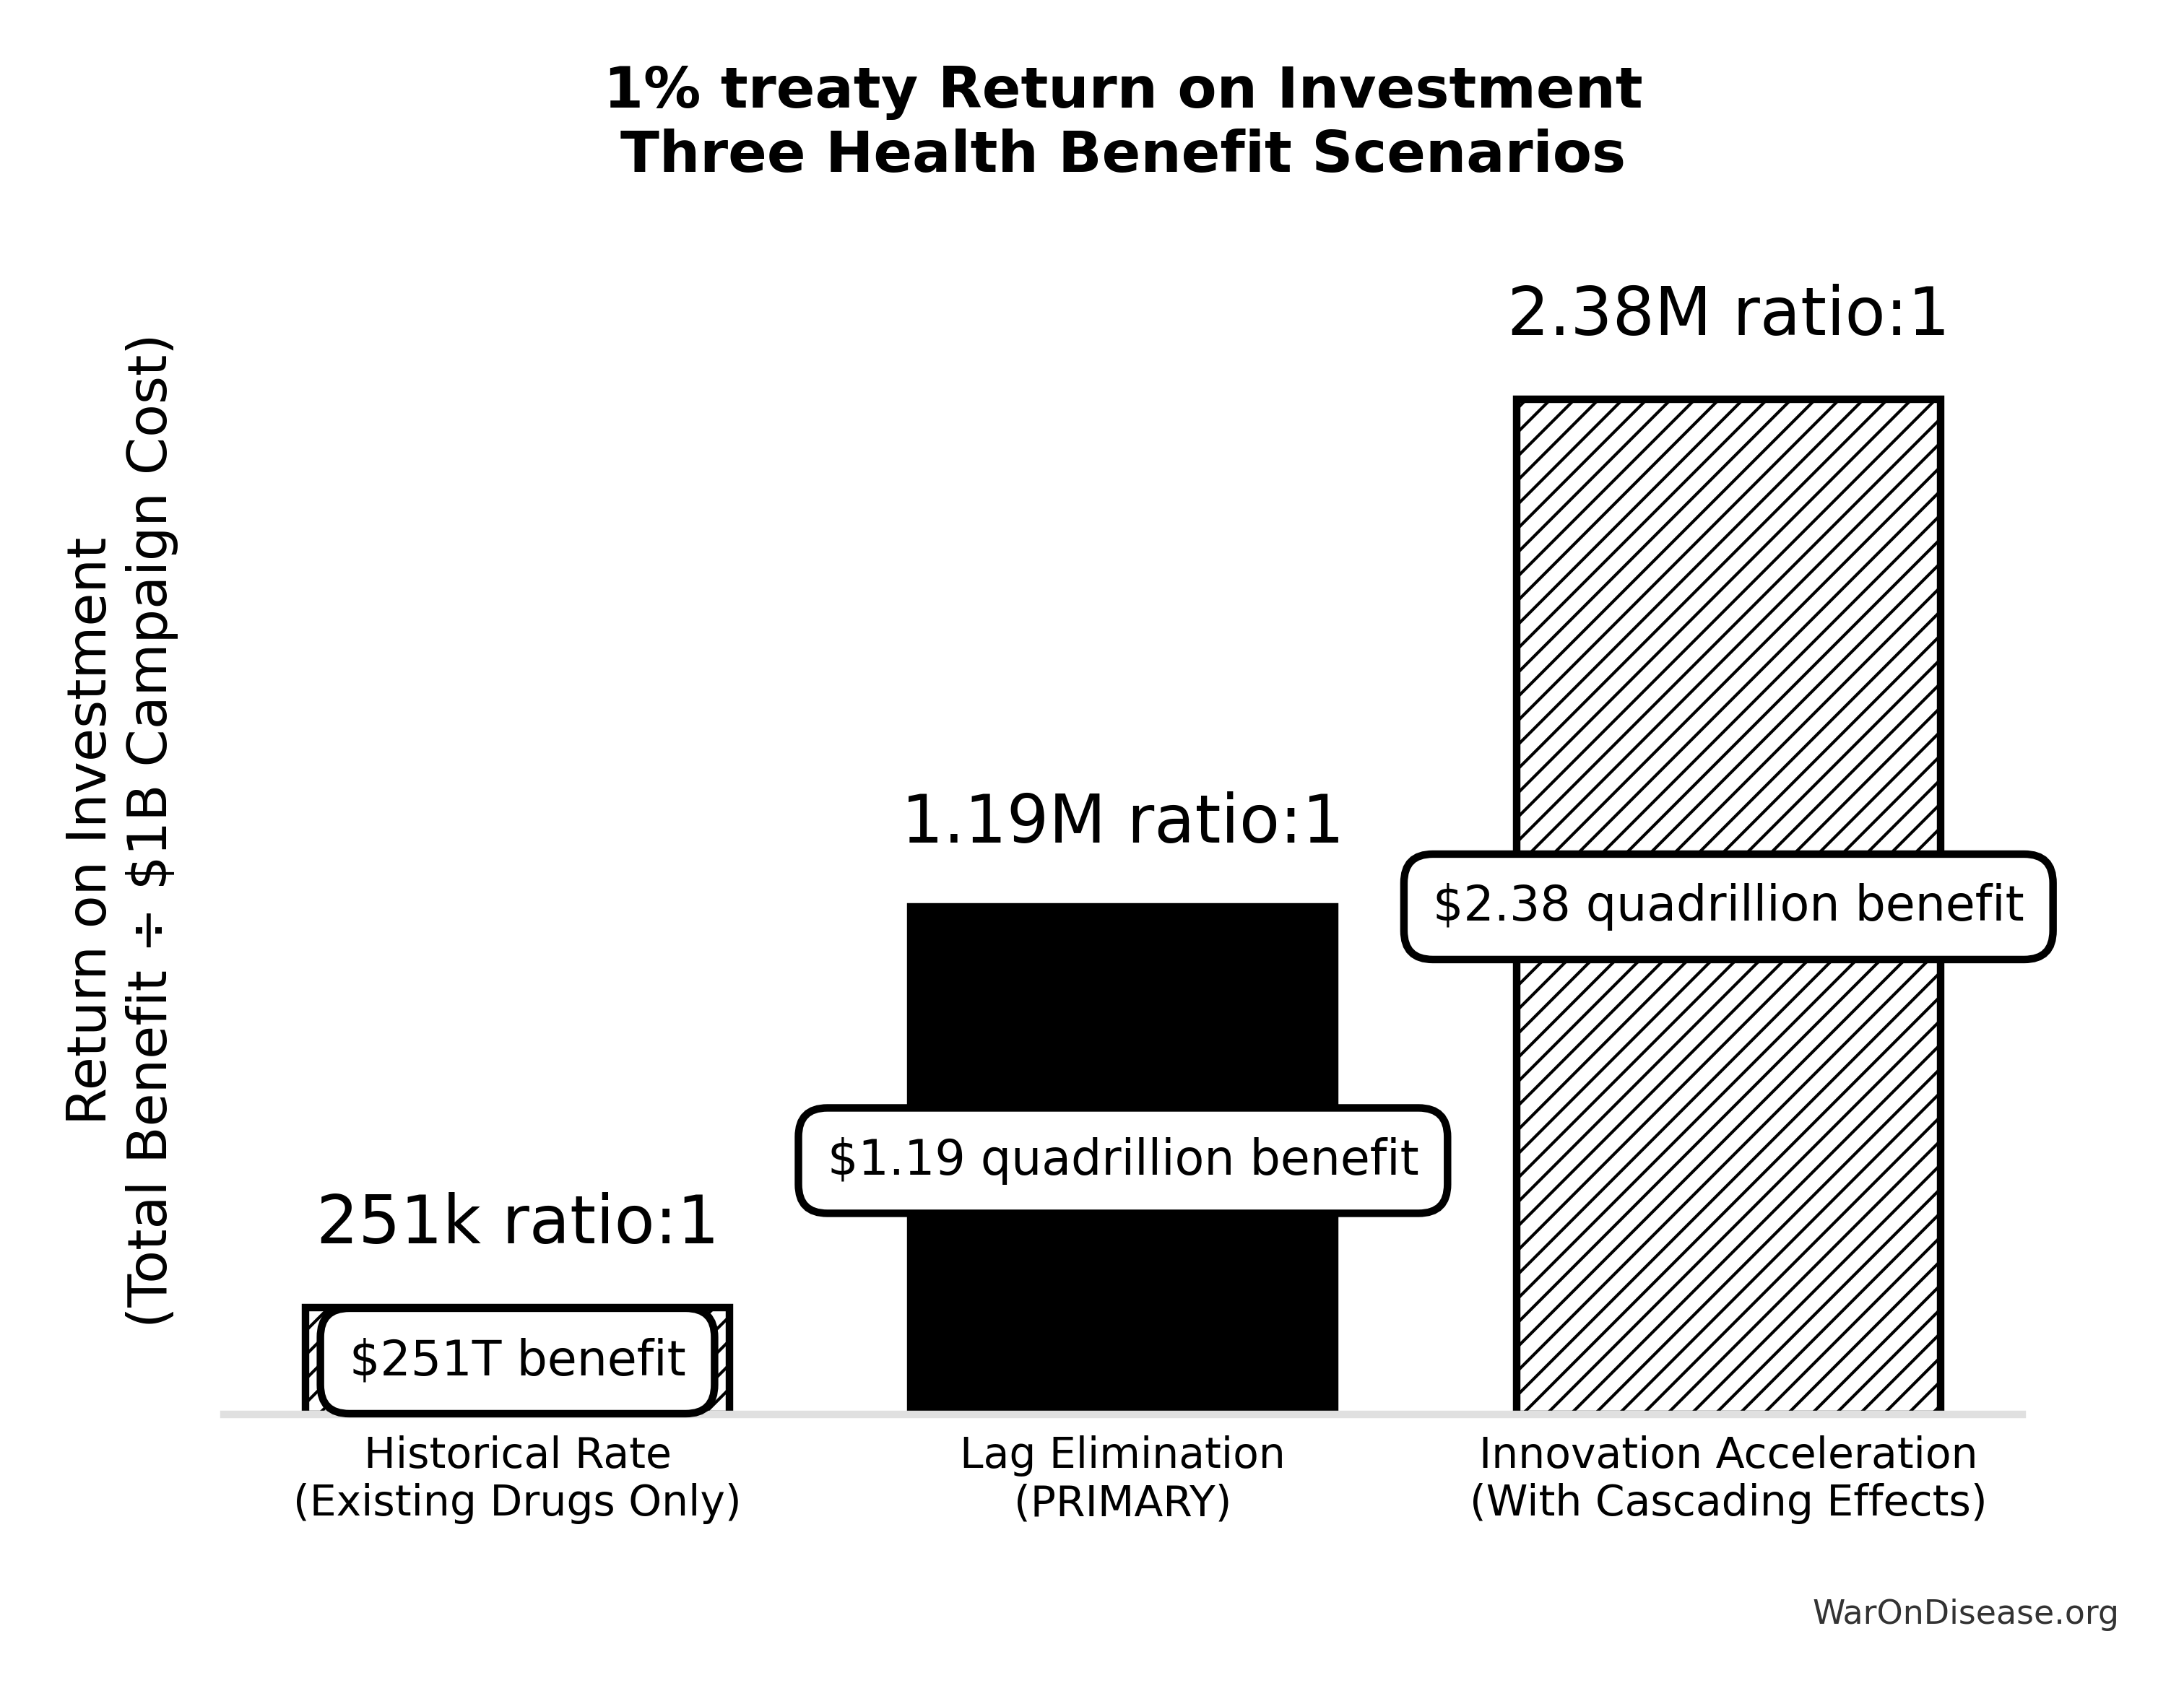
Cost-Effectiveness: Dominant Health Intervention
Most health interventions require ongoing funding. This one generates profit while saving lives.
In health economics, that’s called a dominant intervention - simultaneously reducing costs while improving health outcomes. Smallpox eradication is the historical precedent.
Incremental Cost-Effectiveness Ratio (ICER)
ICER measures how much you pay per year of healthy life gained (QALY):
ICER = (Intervention Cost) / (QALYs Gained)
For a dFDA (using the 8.2-year timeline shift):
Cost per DALY: $0.126 (negative = cost-dominant)
Translation: The intervention saves money while saving lives. Cost-dominant interventions are rare.
Normally, you spend money to save lives. Good interventions cost $50K-$150K per QALY. Great interventions cost $3,000-$50K.
This one is cost-dominant ($0.126 per DALY), meaning it saves money while saving lives.
It’s backwards. The number is negative. Economists call this “dominant” because you don’t have to choose between “saving money” and “saving lives.” You do both.
For comprehensive ICER analysis including sensitivity analysis across multiple scenarios, alternative funding perspectives, and detailed methodology, see dFDA ICER Analysis.
Comparative Cost-Effectiveness vs. GiveWell Top Charities
The standard metric for comparing health interventions is cost per DALY (Disability-Adjusted Life Year) - how much you pay to save one year of healthy life.
GiveWell Top Charities (Gold Standard for Cost-Effectiveness):
- Bed Nets: $89/DALY (Against Malaria Foundation)
- Deworming: $55/DALY (Deworm the World Initiative)
- Vitamin A Supplementation: $37/DALY (Helen Keller International)
A 1% Treaty/decentralized framework for drug assessment:
\[ \text{Multiplier} = \frac{\$89}{\$0.127} = 701\times \]
\[ E[\text{Multiplier}] = \frac{\$89}{\$0.51} = 175\times \]
Translation: Accounting for political uncertainty, a 1% treaty campaign is 7.07× more cost-effective than distributing bed nets, while also being self-funding (generates $155B in annual economic benefits).
The negative cost (net benefit) per life saved distinguishes this as a dominant intervention in health economics terminology, an intervention that both reduces costs and improves outcomes, with no trade-off between efficiency and effectiveness.
Self-Funding Mechanism Through Military Budget Redirection
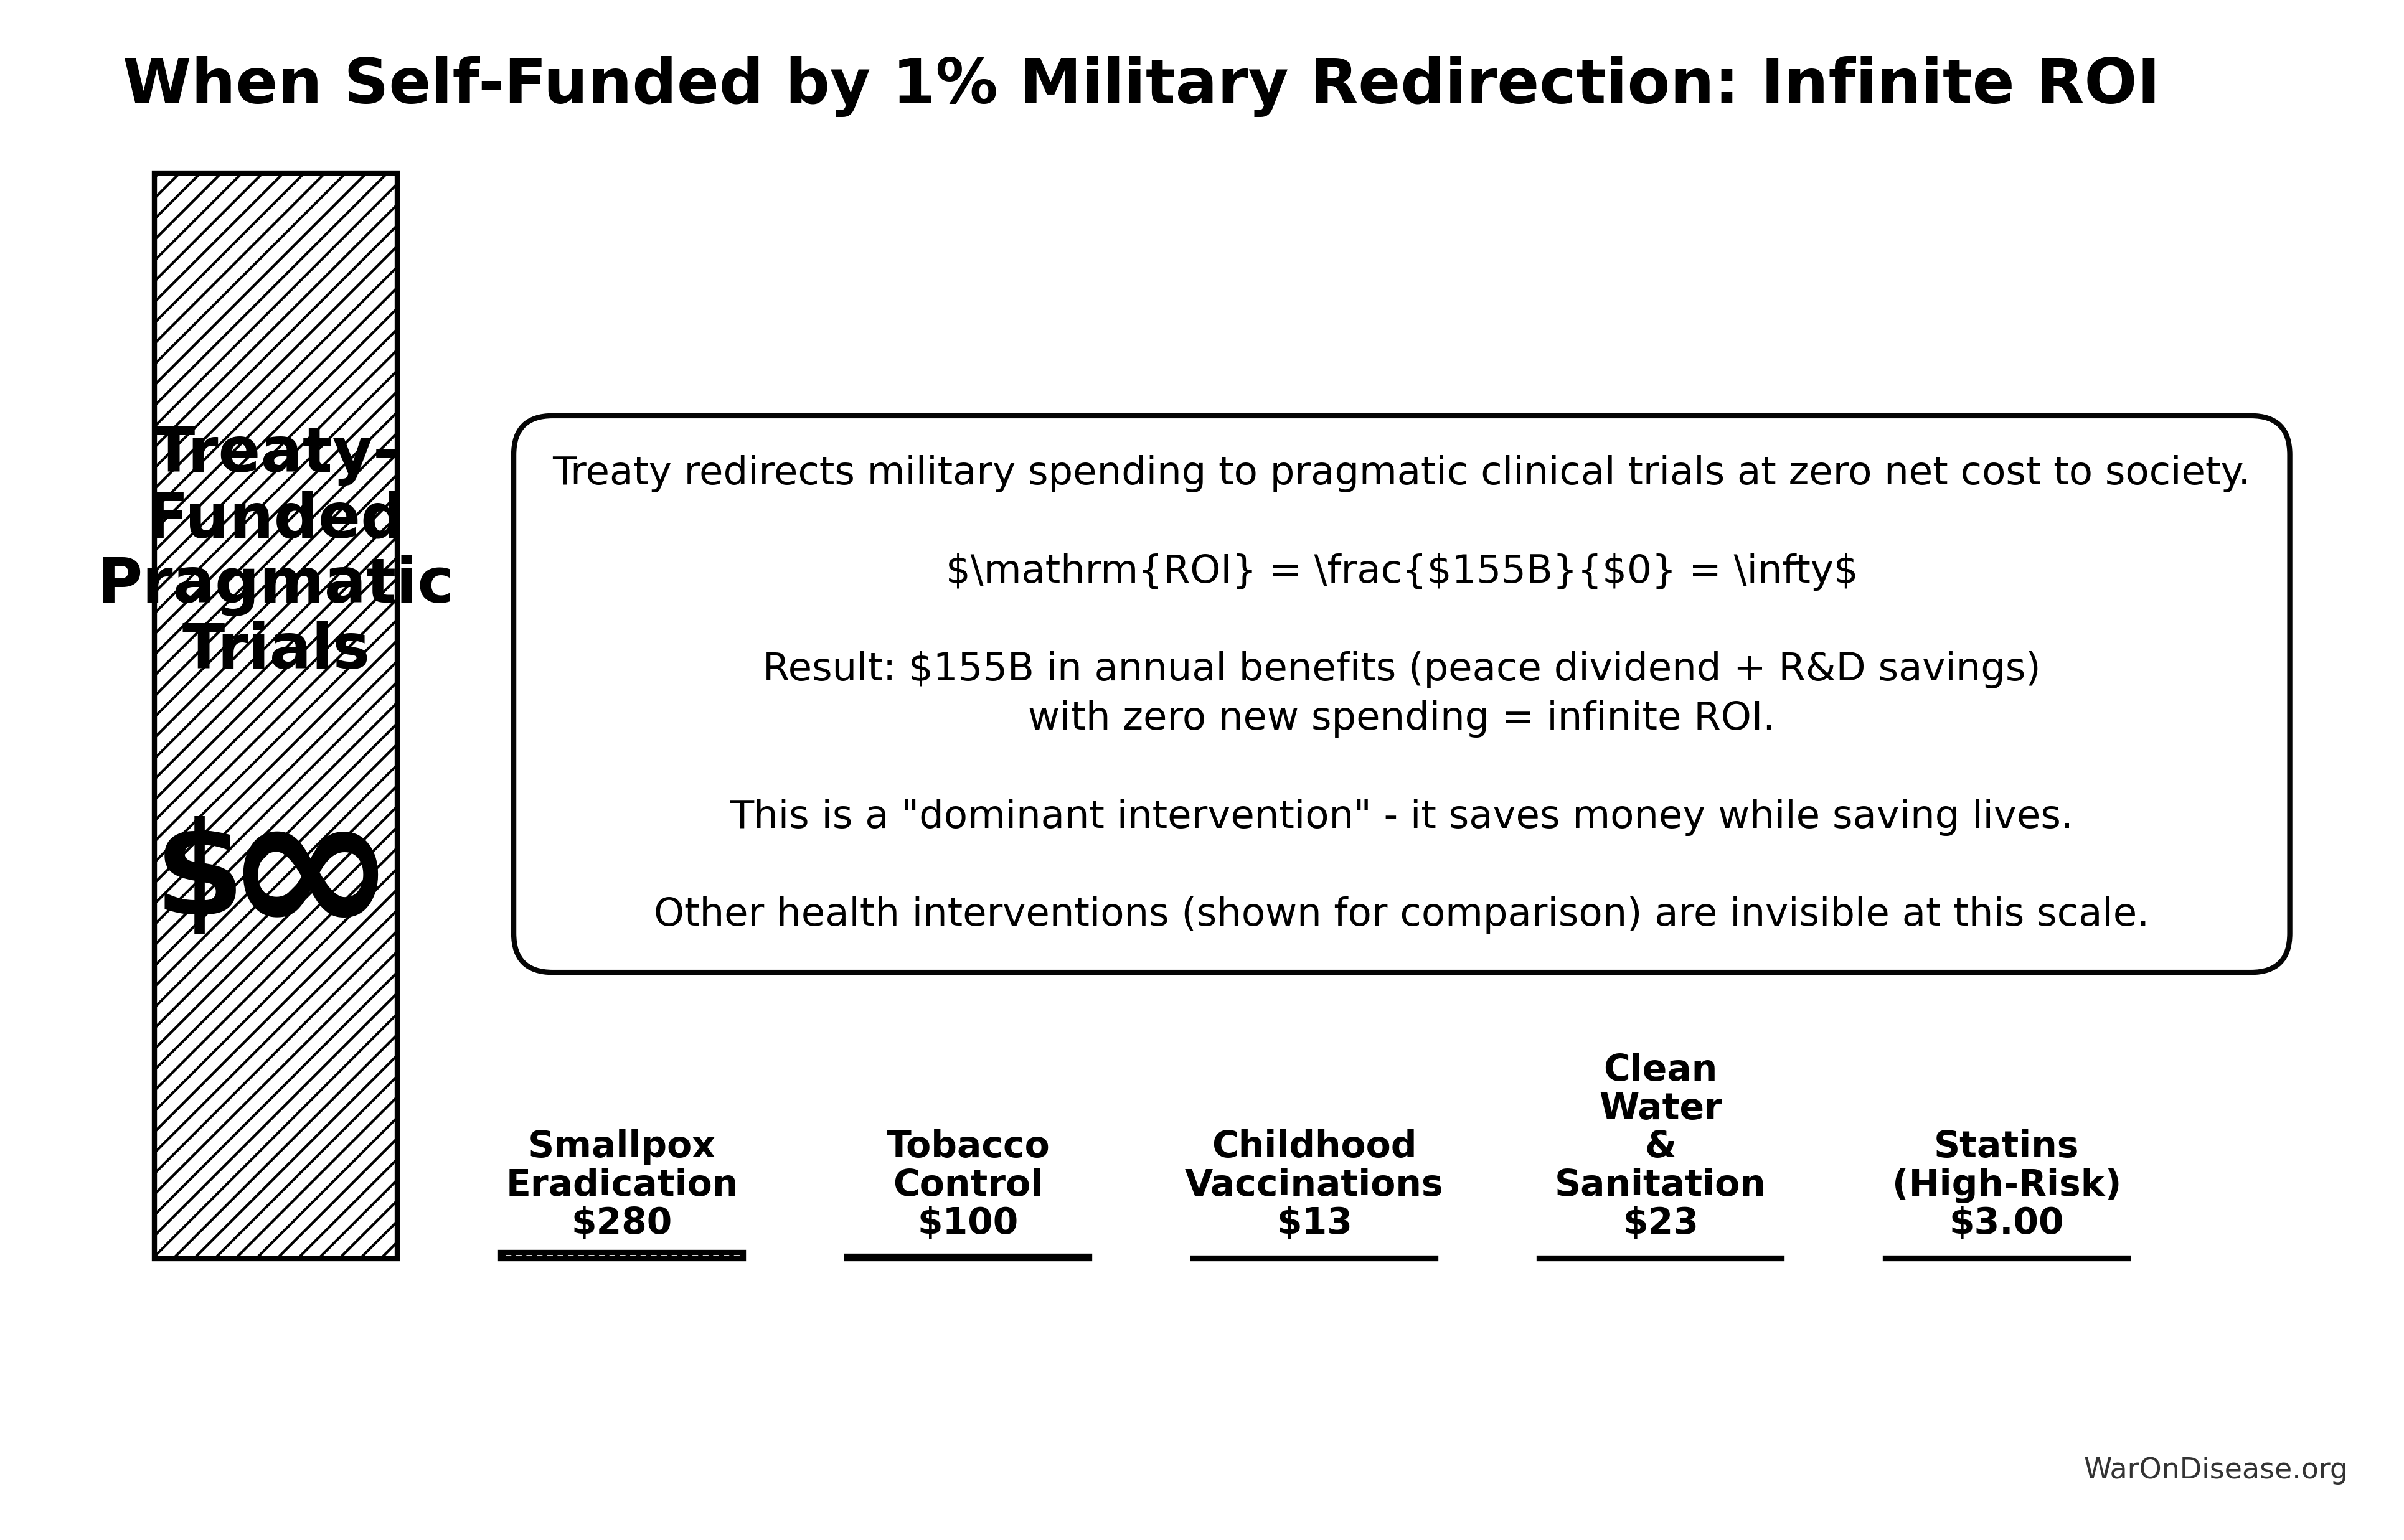
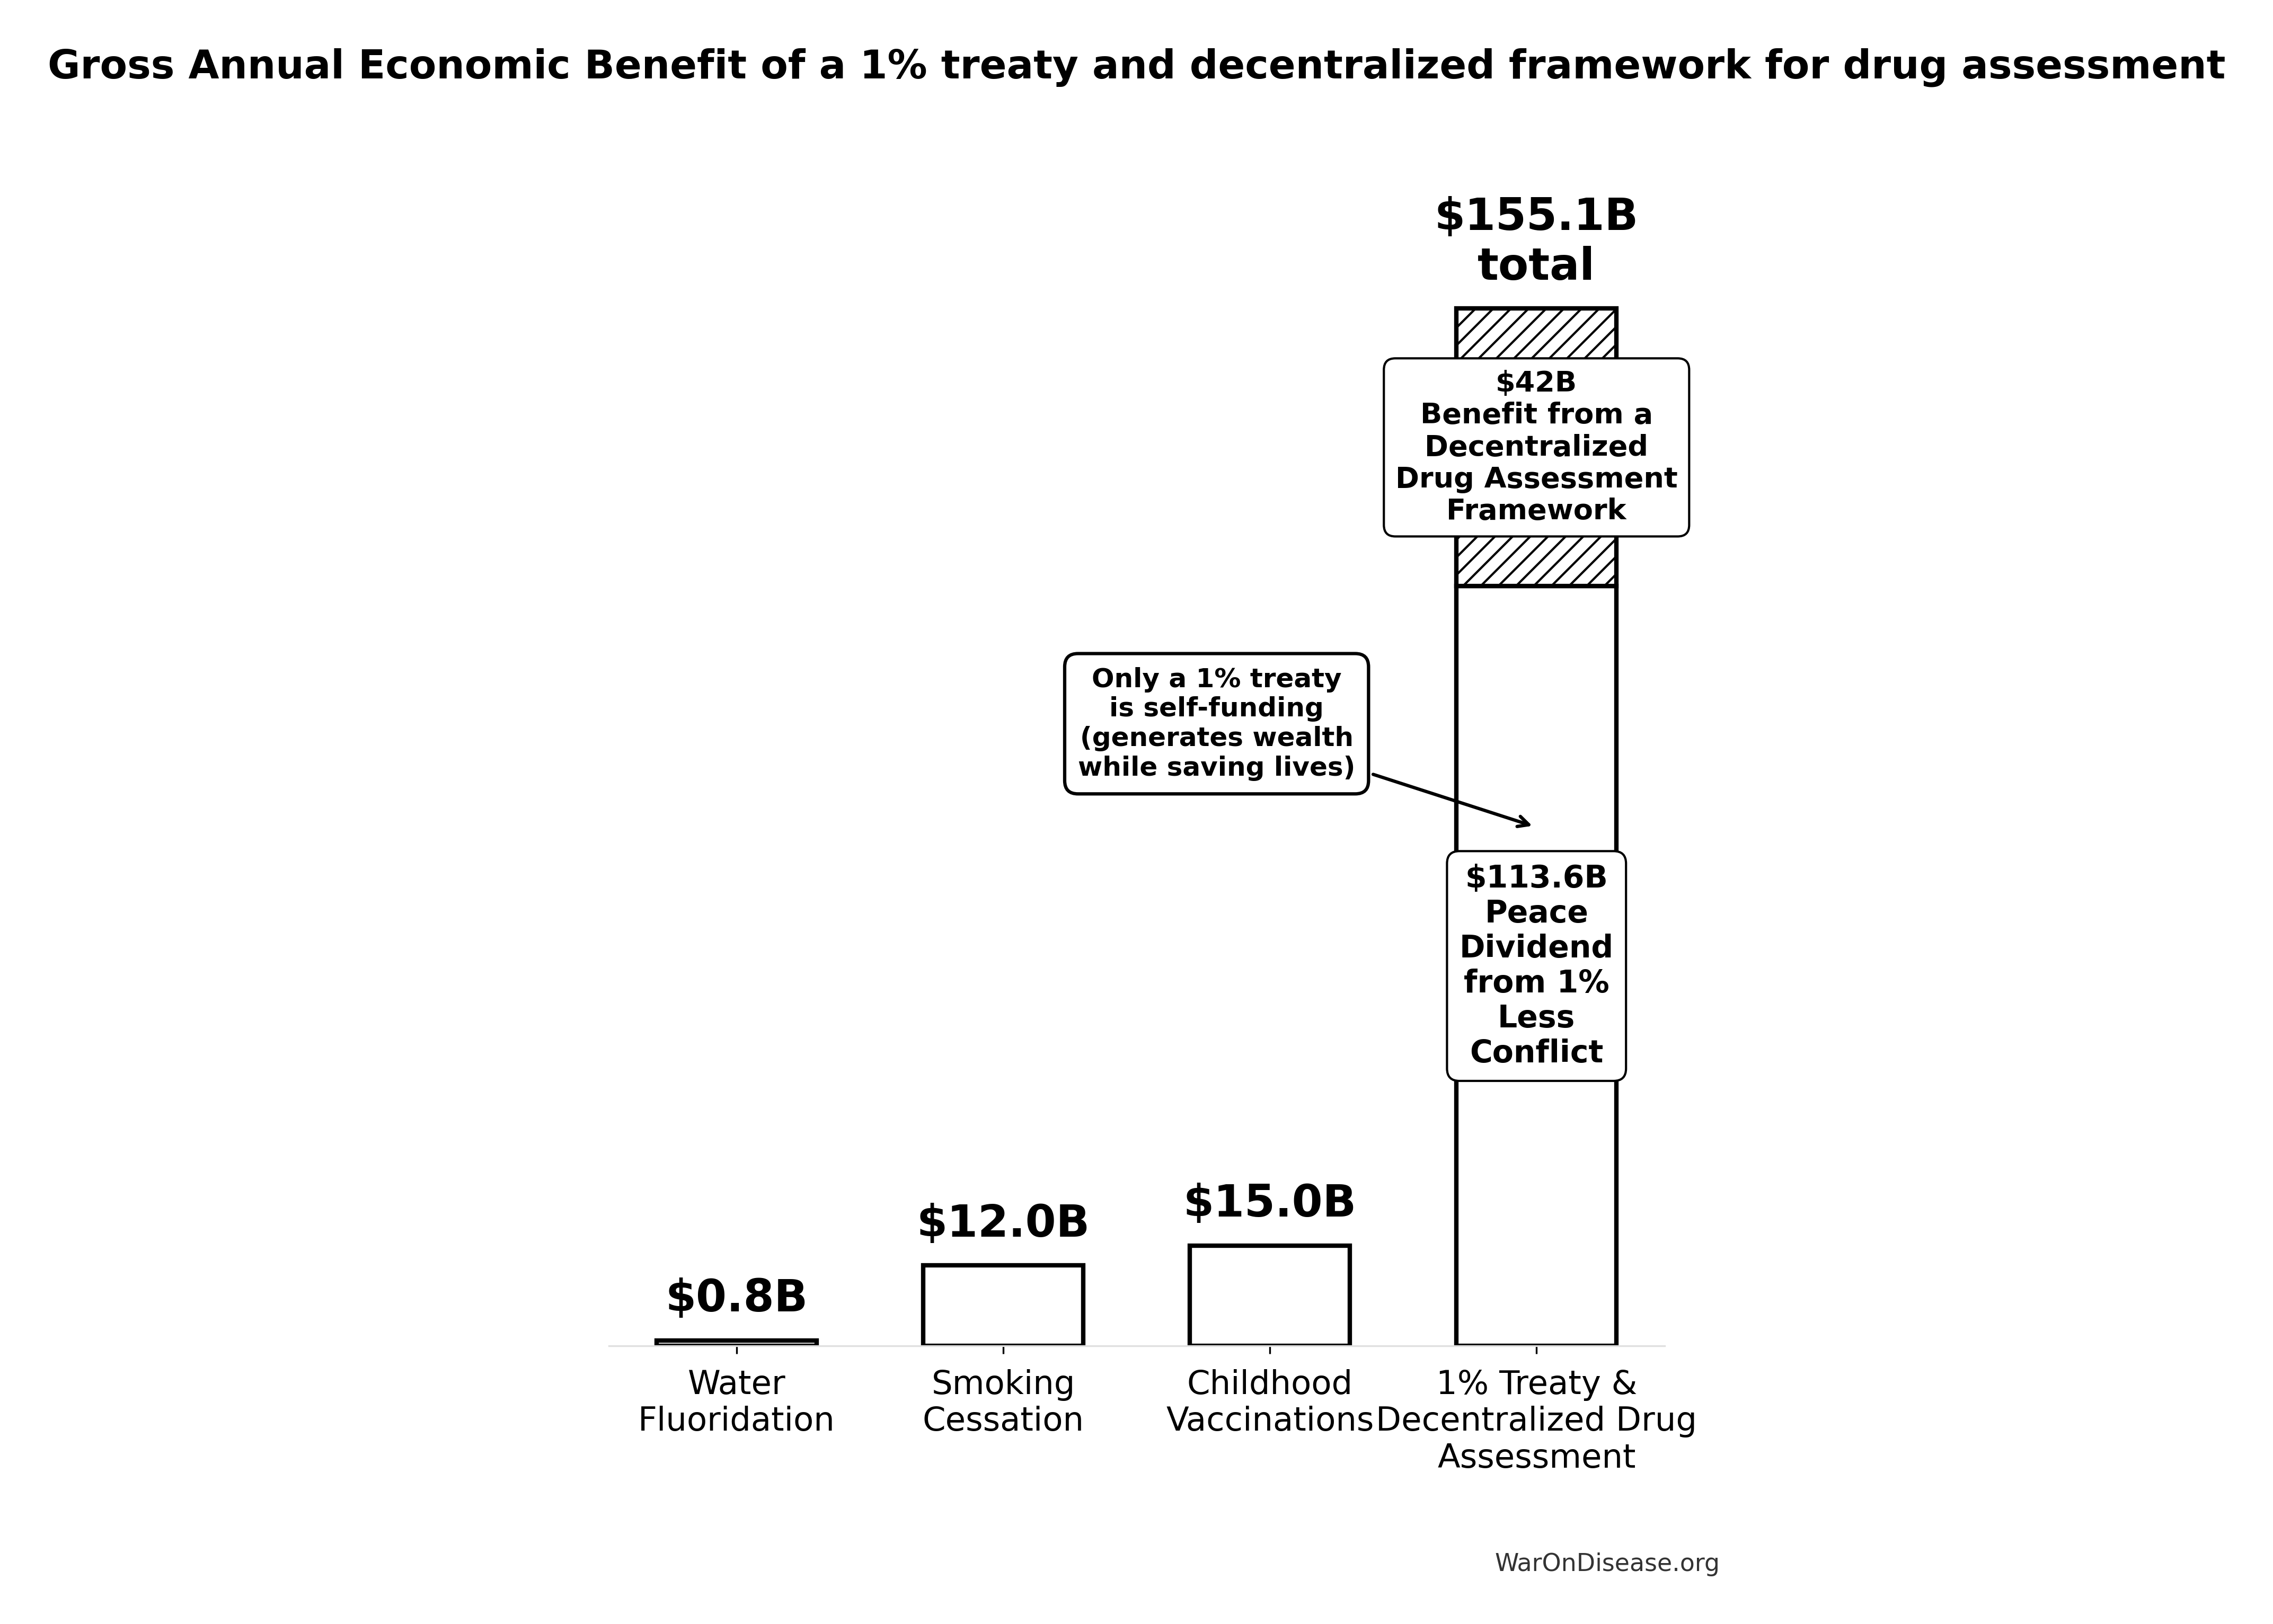
The 1% Treaty financing structure creates a self-funding system requiring zero net new spending from donors or taxpayers.
Economic Structure:
- Funding Source: $27.2B annually from 1% redirection of existing military budgets (money already allocated in national budgets)
Funding Allocation (80/10/10 split):
| Allocation | Percentage | Annual Amount | Purpose |
|---|---|---|---|
| Pragmatic Clinical Trials | Patient subsidies, dFDA operations | ||
| VICTORY Incentive Alignment Bond Returns | 10% |
$2.72B |
Perpetual investor payments |
| IAB Political Incentives | 10% |
Incentive Alignment Bonds for legislators |
Within the 80% allocated to pragmatic clinical trials:
- Patient Trial Subsidies: $21.7B/year subsidizing patient participation in clinical trials
- At $500 Oren Cass (2023) per patient (RECOVERY trial cost), this funds 43.4M patients annually
- Patients choose which trials to join; trials that attract patients get funded
- ALL remaining funds go to patient subsidies - no separate bureaucracy or overhead budget
- Decentralized Framework for Drug Assessment Operations: $40M/year for core infrastructure
- Annual Benefits: $155B (Peace dividend: $114B + R&D savings: $41.5B)
- Operating Costs: $290M annually (campaign operations and dFDA infrastructure)
- Net Position: $155B annual surplus after all costs
- Lives Saved: 416M annually
- Cost per Life Saved: Net societal benefit per life (negative cost indicates net profit, meaning the system generates economic value while saving lives)
This financing structure classifies the 1% Treaty as a dominant health intervention using standard health economics terminology, an intervention with both lower costs and better health outcomes than the status quo, requiring no trade-off between cost-effectiveness and impact.
The self-funding nature eliminates traditional barriers to scale, as the intervention generates sufficient economic surplus to sustain and expand operations without ongoing charitable contributions.
Scenario Analysis: Complete Case
1.19M:1 ROI
The conservative scenario counted only R&D efficiency gains. This section includes all quantifiable benefit categories.
Annual Recurring Benefits Breakdown
$155B in recurring annual benefits (perpetual)
Core recurring benefit streams:
- Peace dividend ($114B) - Building 1% fewer things that explode
- R&D cost savings ($41.5B) - Trials cost 82 M. Institute× less
Total recurring annual benefits
\[ Benefit_{total} = Benefit_{DFDA,ann} + Cost_{soc,ann} = \$41.50B + \$113.55B = \$155.05B \]
That’s $155B per year (recurring perpetually).
Important Note: Regulatory delay elimination provides a one-time 8.2-year timeline shift forward in curing diseases, not an annual recurring benefit. This one-time benefit is massive ($1.19 quadrillion total economic value from timeline shift) but occurs once when the delay is eliminated, not every year. The recurring annual benefits above ($155.1B/year) represent only the peace dividend and R&D savings, which continue perpetually. See Regulatory Mortality Analysis for the one-time timeline shift methodology.
Complete Case ROI
\[ ROI_{lag\_elimination} = \frac{\$1{,}286T}{\$1.00B} = 1{,}286{,}242:1 \]
Translation: Every $1 invested returns $1.19M in recurring annual benefits (peace dividend + R&D savings), plus a one-time 8.2-year timeline shift in disease eradication (not included in annual figure).
Sensitivity of complete ROI: The tornado chart below shows which parameters most affect the complete ROI estimate:
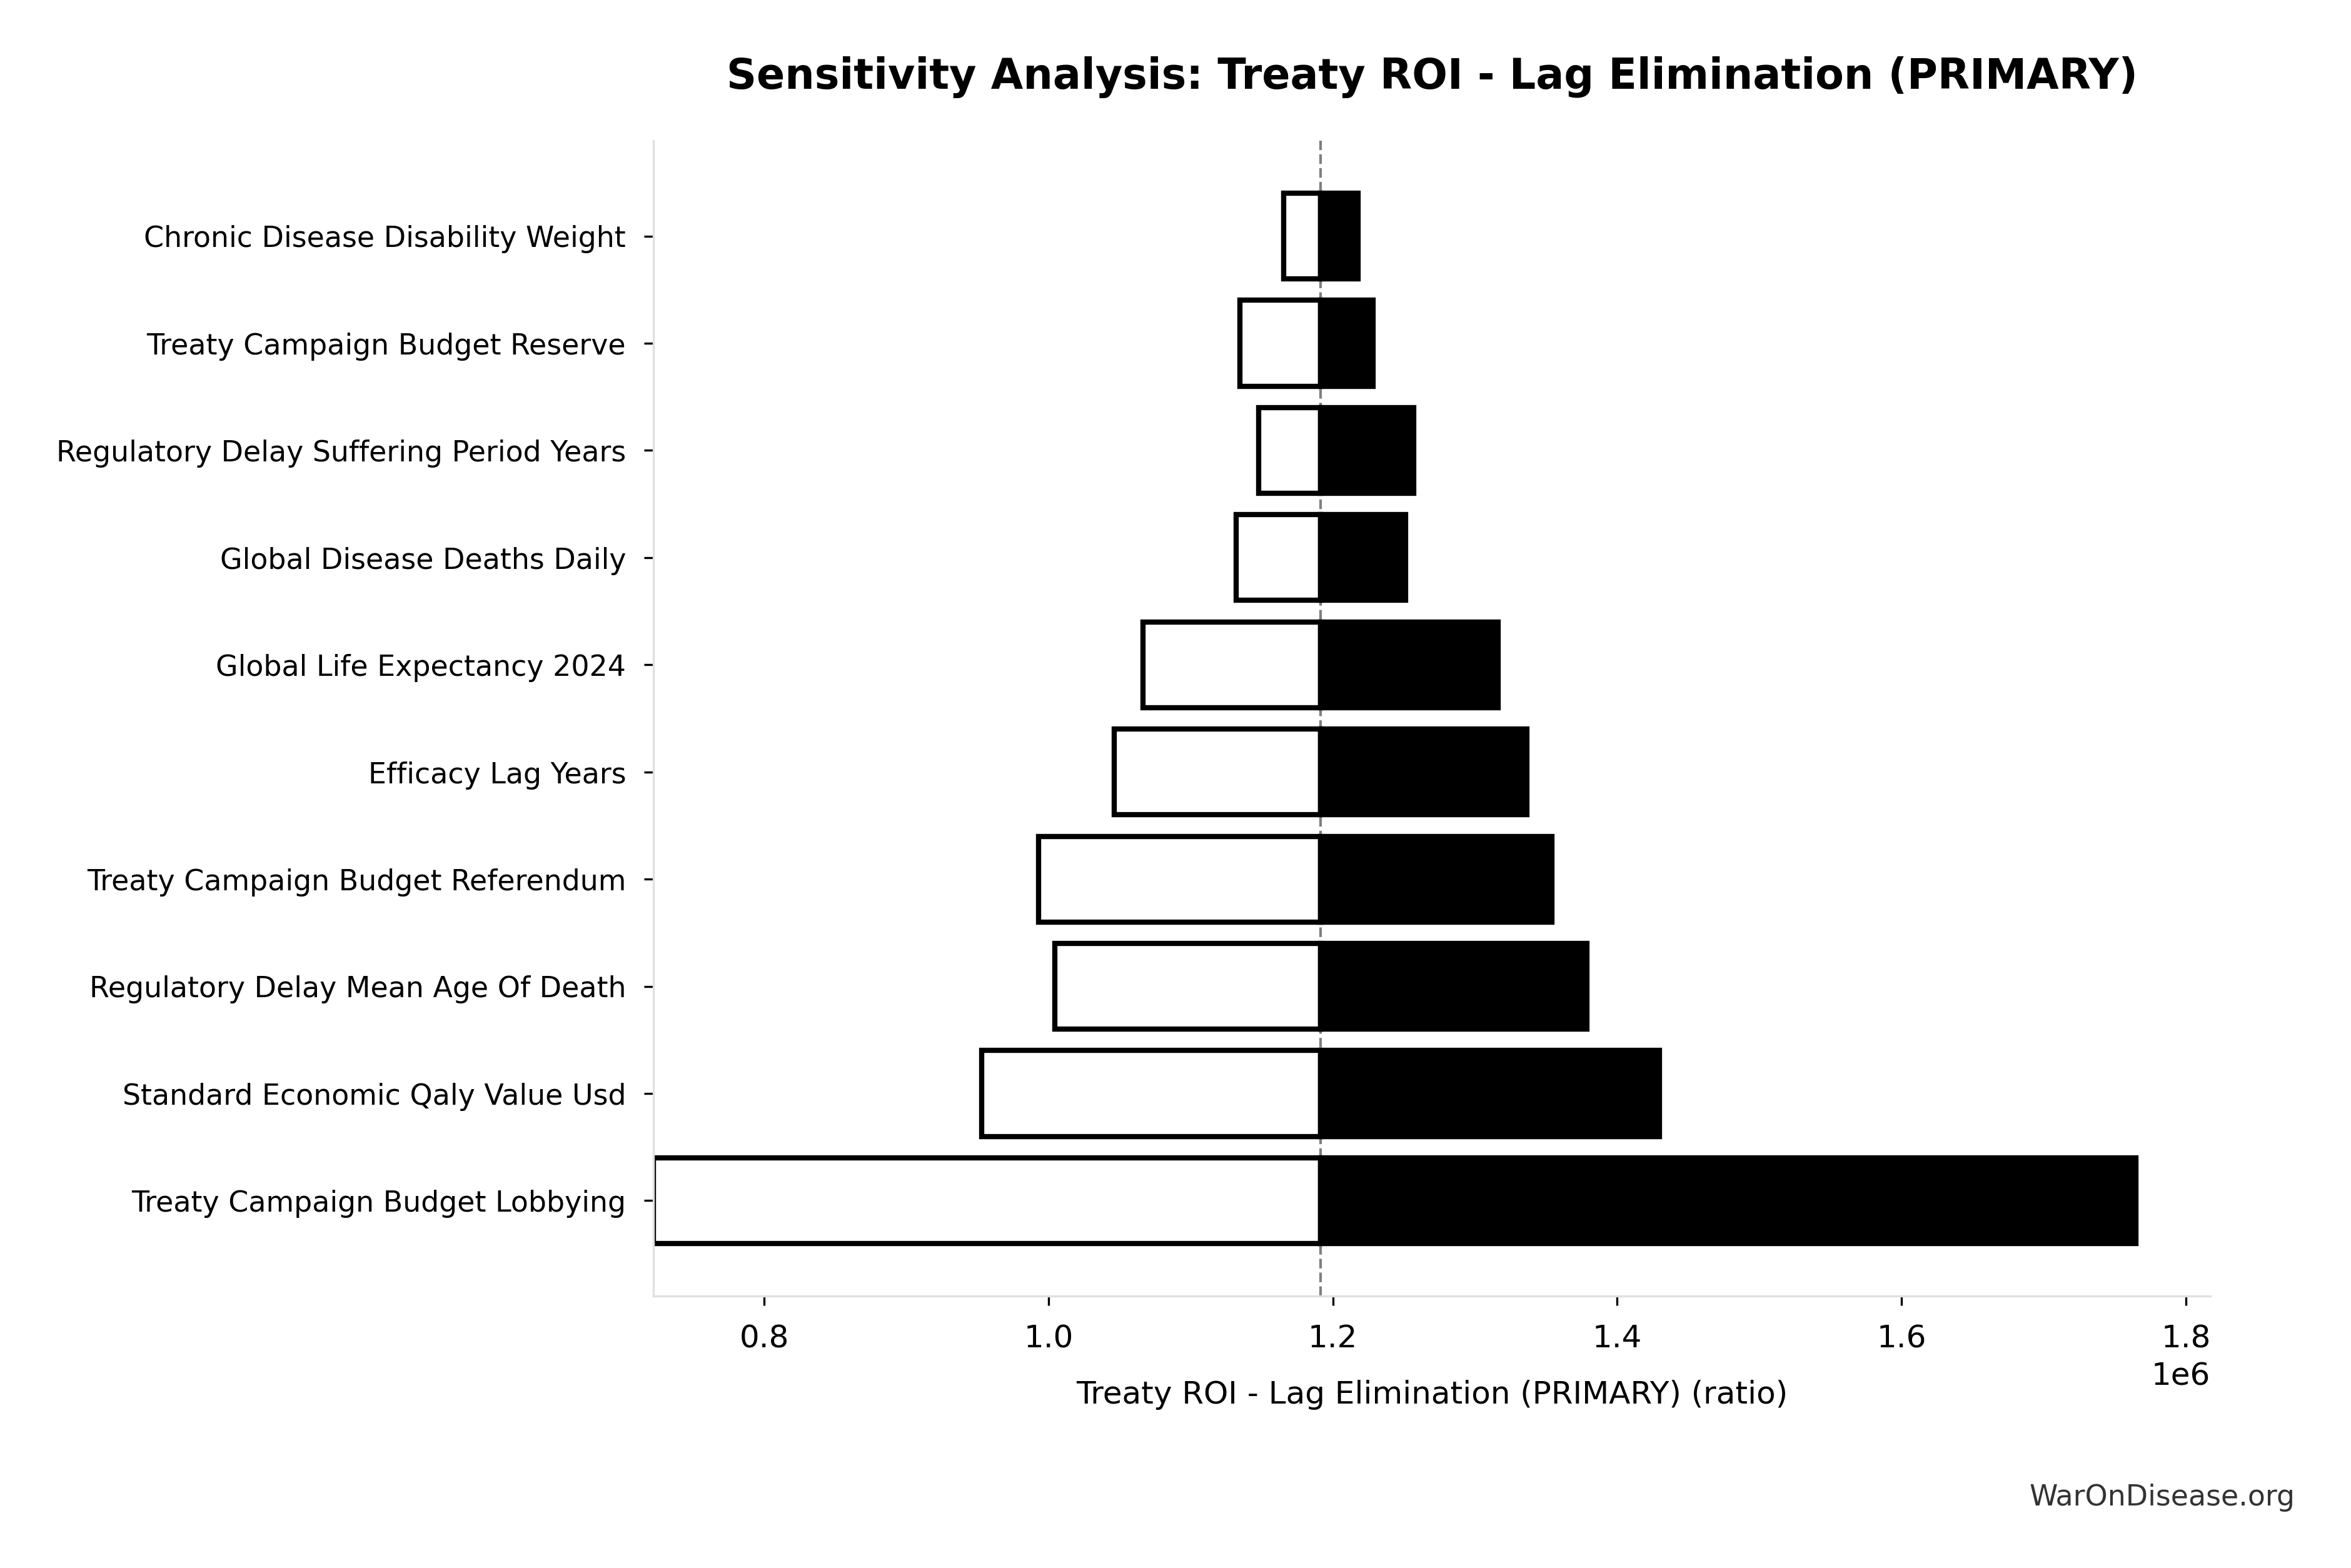
These estimates derive from:
- Proven trial costs (RECOVERY: 82× cost reduction demonstrated)
- Disease prevalence data (WHO Global Health Observatory)
- Standard QALY valuations (health economics consensus thresholds)
Critical distinction - the two benefit categories are different things:
| Benefit Category | Type | Value | Frequency | Description |
|---|---|---|---|---|
| Timeline Shift | One-time | Once | Eliminating 8.2-year regulatory delay shifts disease eradication 8.2 years earlier. Saves 416M lives and 7.94B DALYs. See Regulatory Mortality Analysis | |
| Peace Dividend | Recurring | $114B/year | Perpetual | 1% reduction in global military spending redirected to pragmatic clinical trials |
R&D Savings | Recurring | $41.5B/year | Perpetual | 82× trial cost reduction from pragmatic trial model |
Total Recurring | Recurring | $155B/year | Perpetual | Peace dividend + R&D savings (makes system self-funding) |
Total Value | Combined | $1.19 quadrillion + recurring | Once + perpetual | One-time timeline shift + perpetual annual benefits |
Total Recurring | Recurring | $155B/year | Perpetual | Peace dividend + R&D savings (makes system self-funding) |
Total Value | Combined | $1.19 quadrillion + recurring | Once + perpetual | One-time timeline shift + perpetual annual benefits |
Investment required: $1B (one-time campaign cost)
Efficacy lag uncertainty: The timeline shift depends on the efficacy lag parameter, which represents years of regulatory delay after safety is established. The distribution below shows the uncertainty range:
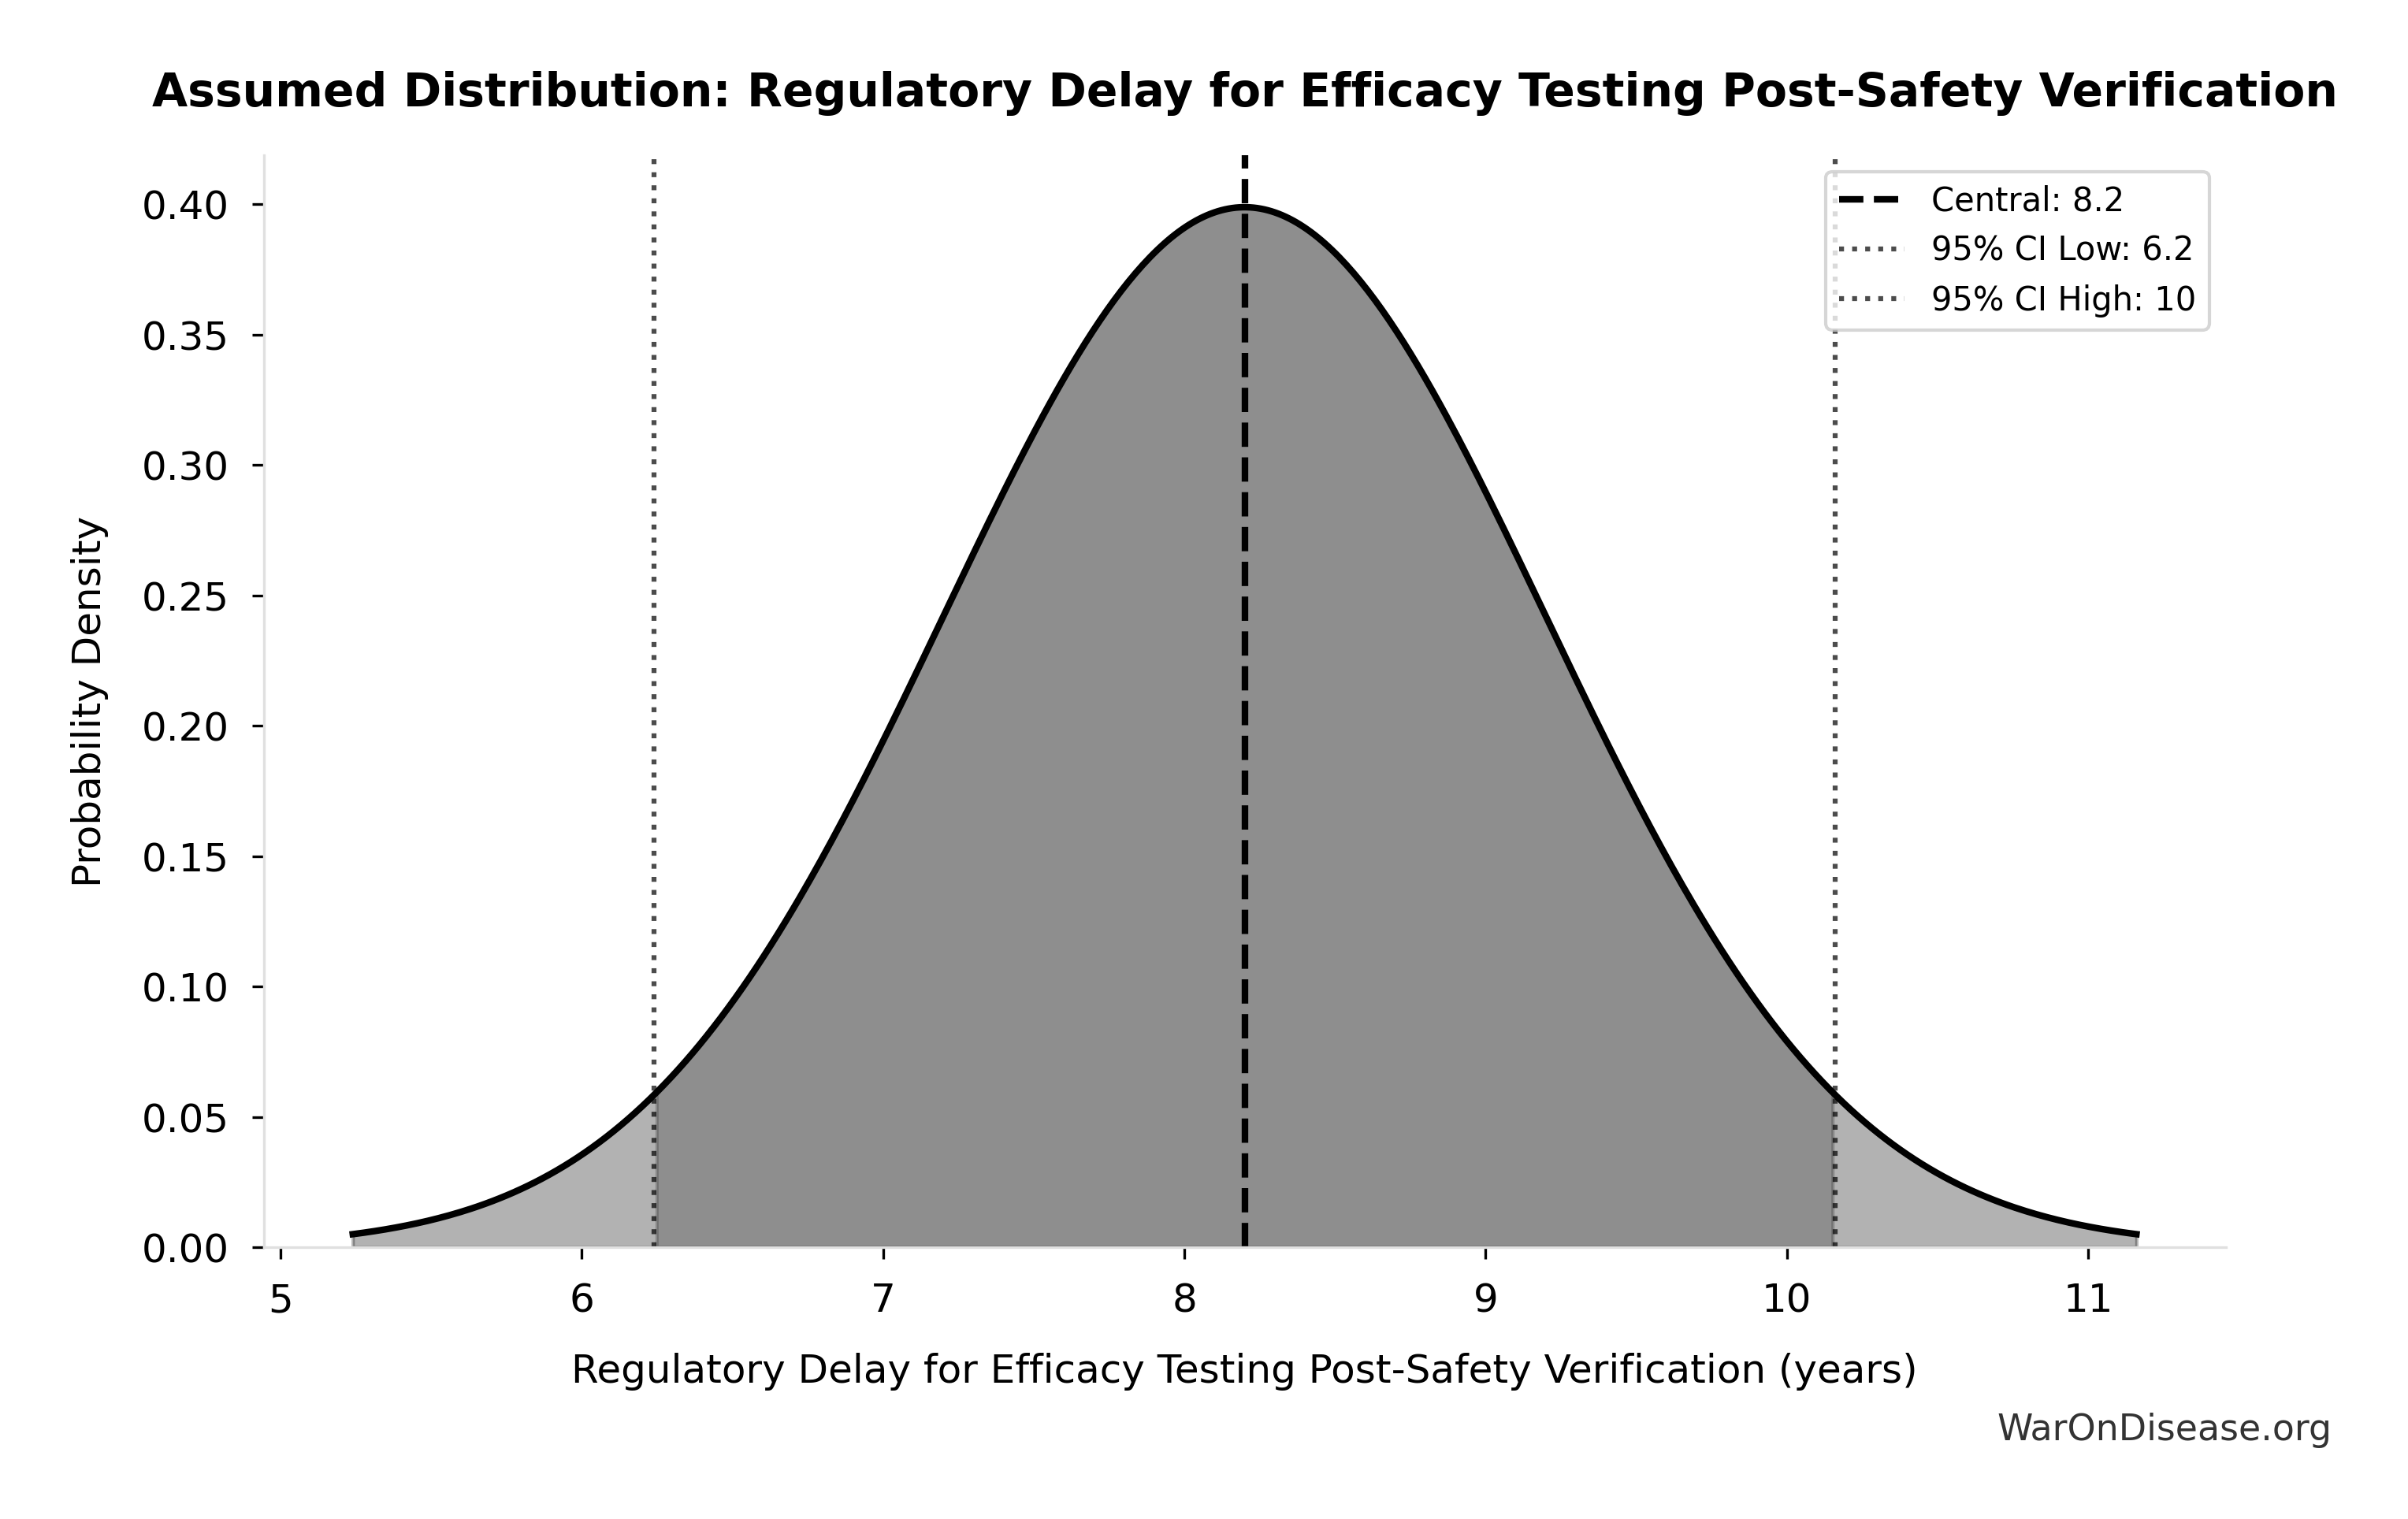
This chart shows the assumed probability distribution for this parameter. The shaded region represents the 95% confidence interval where we expect the true value to fall.
Trial Capacity Scaling
The 22.8× research acceleration multiplier comes from scaling the Oxford RECOVERY trial approach globally:
Current System Baseline:
- 3.30k Research & Markets (2024) clinical trials initiated per year
- 10.0k via active trials at any time (3-5 year duration)
- 0.0792% patient participation (1.90M trial slots for 2.40B people with chronic disease)
- 40% estimates abandonment rate (studies never complete)
Pragmatic Trial System Performance (RECOVERY model scaled globally):
- 75.4k trials/year capacity
- Minimal exclusion criteria (vs. 86% excluded in traditional trials)
- 47,000 patients across nearly 200 sites in 3 months (RECOVERY)
How the 22.8× Multiplier Works:
The acceleration comes from simple economics: The 1% Treaty Fund can fund 43.4M patients/year at RECOVERY trial cost ($500/patient), compared to current global trial participation of 1.90M patients/year (IQVIA 2022).
\[ Multiplier = \frac{Fundable_{ann}}{Trials_{curr}} = \frac{43.4M}{1.9M} = 22.85 \]
This represents the funding capacity from the 1% Treaty Fund alone, without assuming behavior changes from the existing $67.5B baseline research ecosystem.
Net Effect:
- 22.8× more completed trials/year
- From 50 drug approvals/year → proportionally more approvals
- From $41K cost per patient → $500 Oren Cass (2023) cost per patient (82× cost reduction, proven by Oxford RECOVERY trial)
Why More Trials = More Cures (No Diminishing Returns): Crucially, this 22.8x increase in capacity translates directly into medical progress because humanity has empirically tested only 0.417% of the known therapeutic landscape. We are not facing diminishing returns; we are facing a cost barrier that has prevented us from testing 99.6% of plausible treatments. See The Myth of Diminishing Returns for the mathematical proof that the search space is effectively infinite relative to our current efforts.
Individual-Level Economic Impact
The aggregate societal benefits ($155B-$155B annually) result from individual economic gains multiplied across billions of people. Understanding individual impact helps explain both the scale and the equity of the Disease Eradication Model.
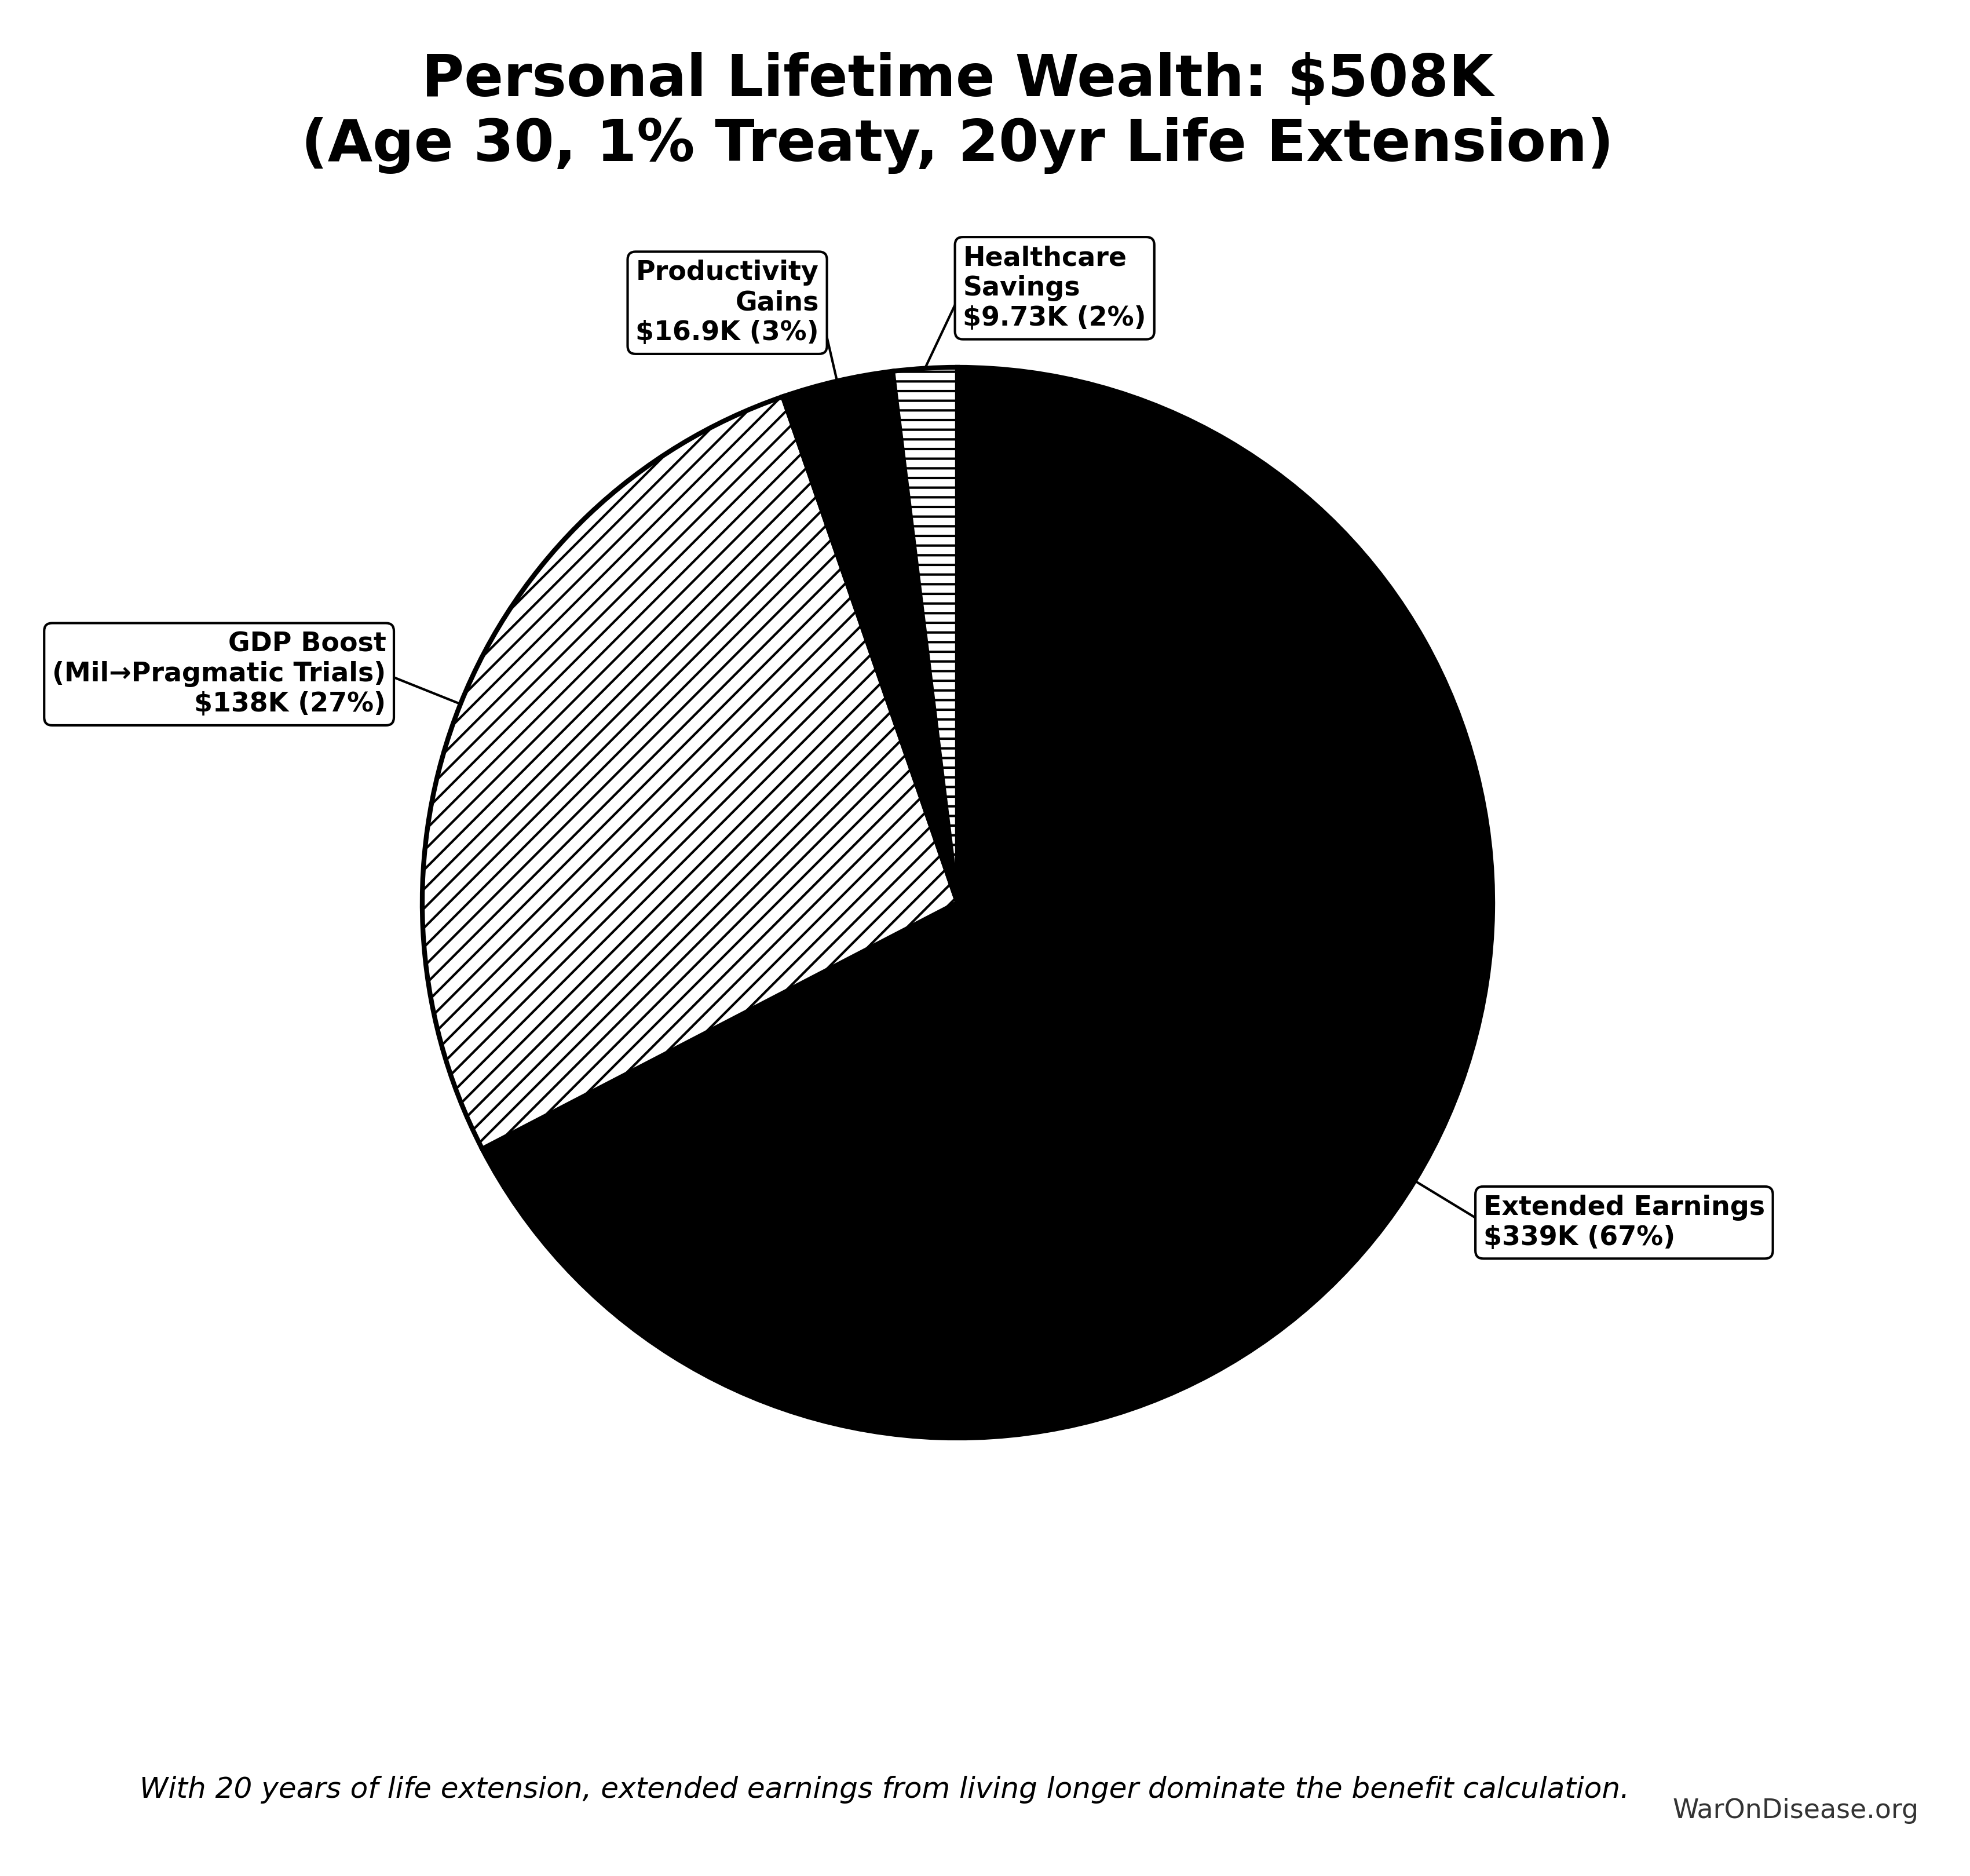
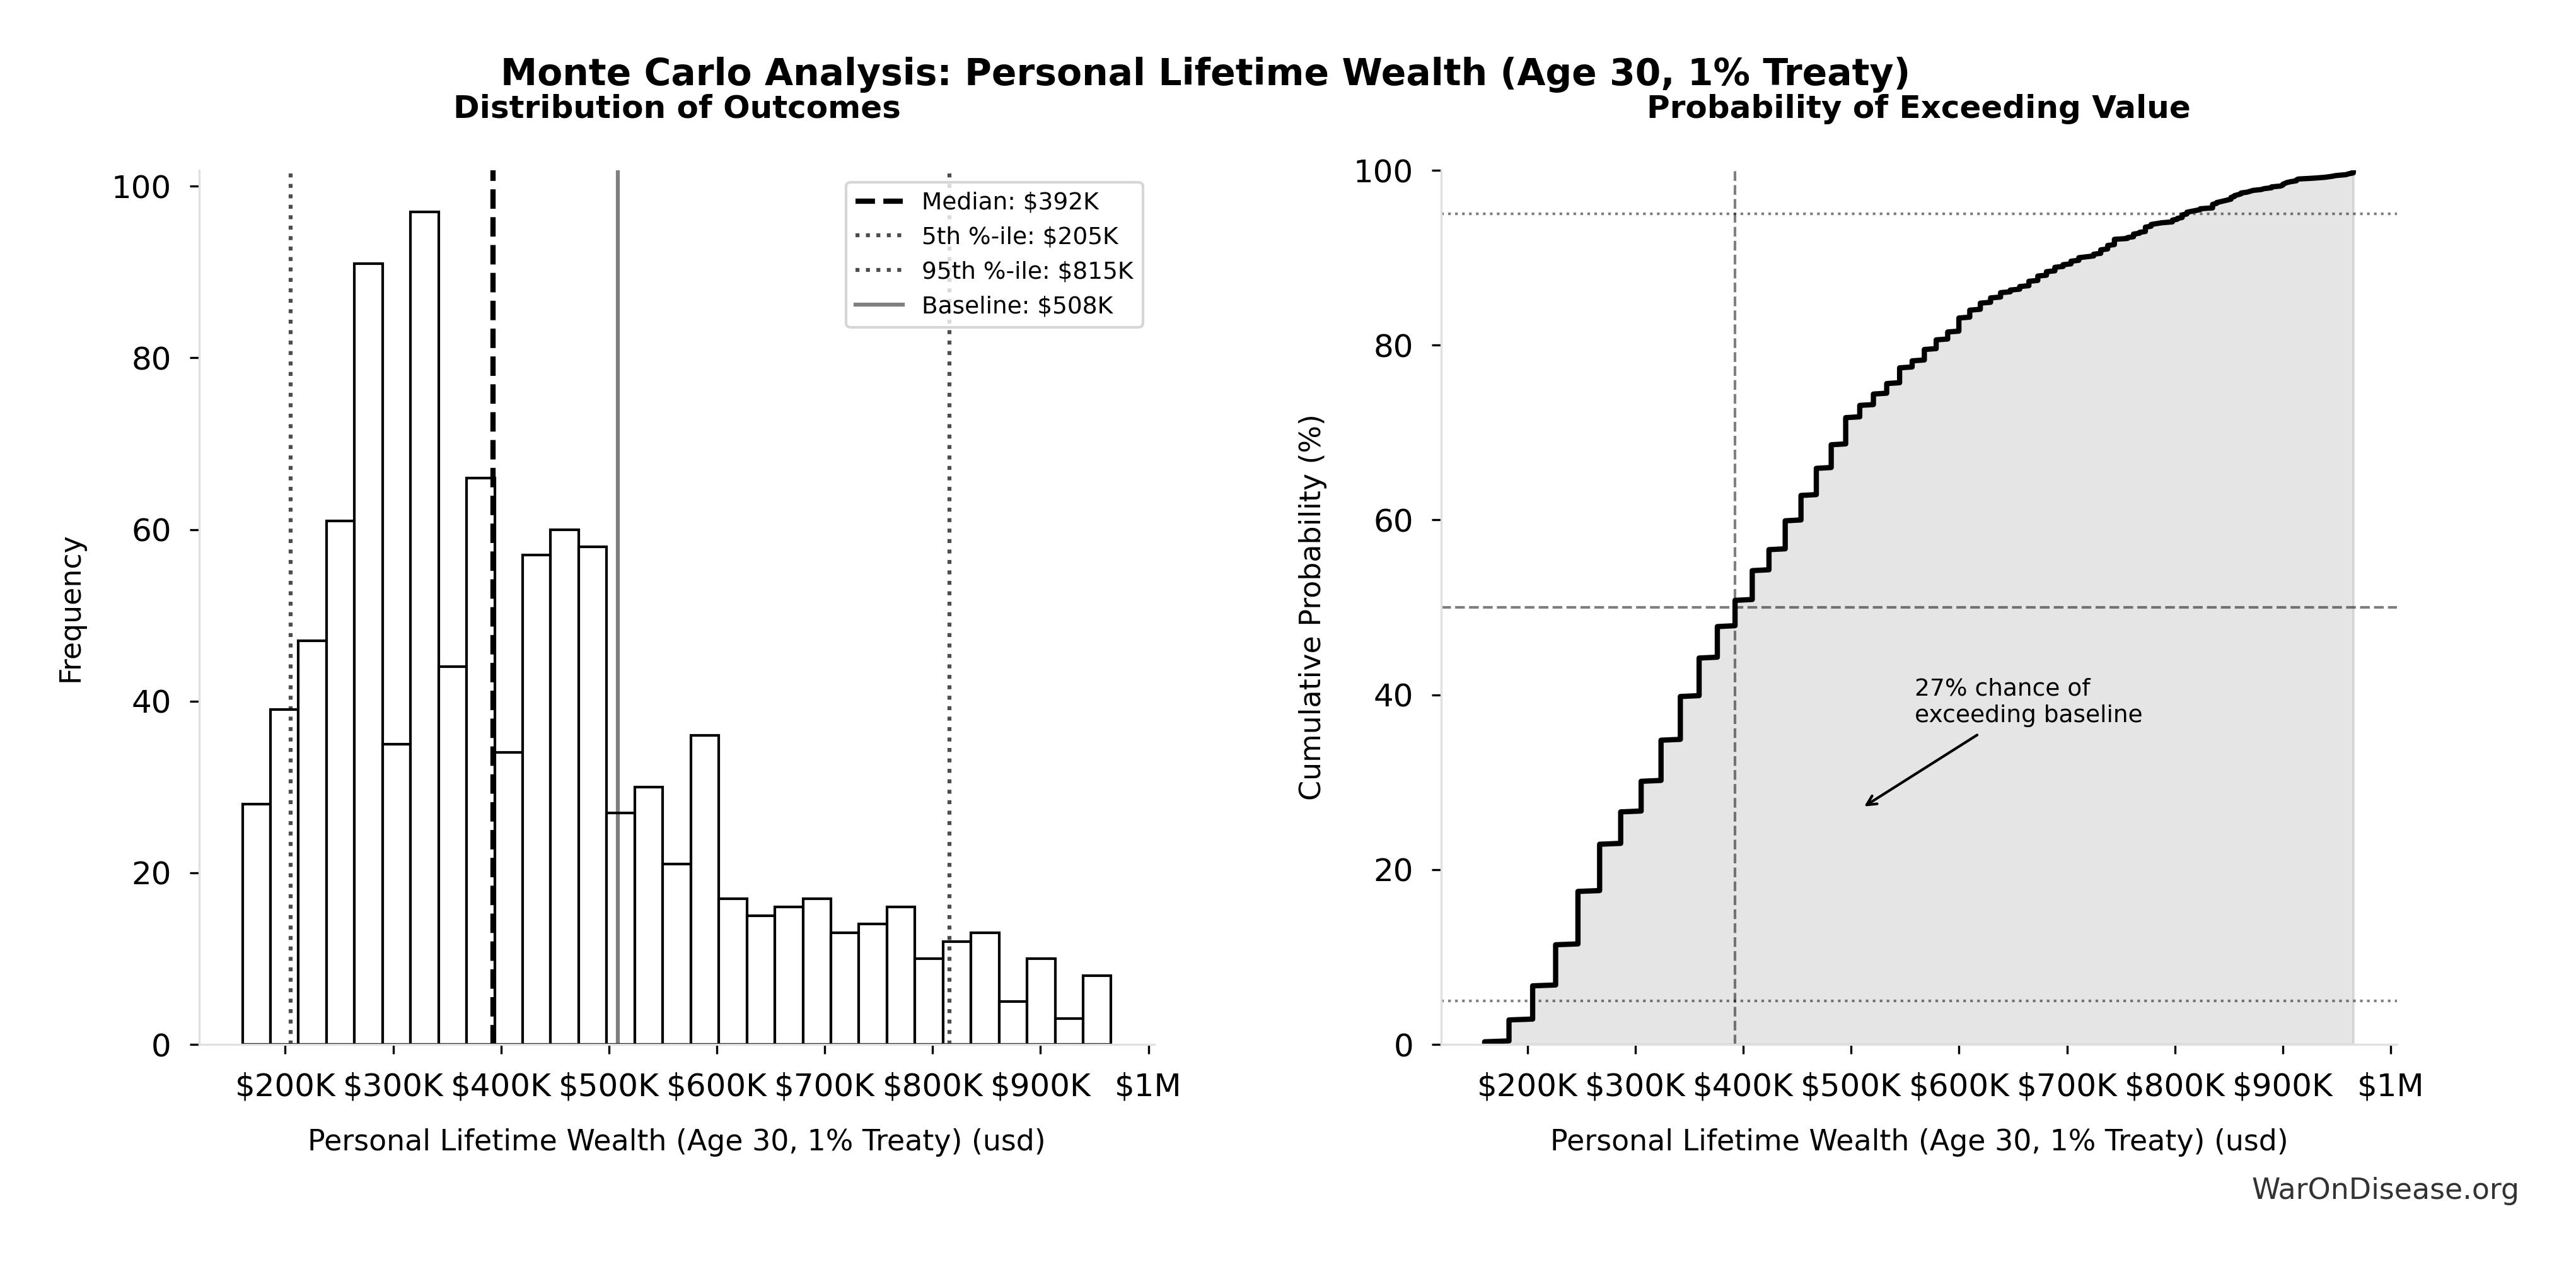
Simulation Results Summary: Personal Lifetime Wealth (Age 30, 1% Treaty)
| Statistic | Value |
|---|---|
| Baseline (deterministic) | $508K |
| Mean (expected value) | $437K |
| Median (50th percentile) | $392K |
| Standard Deviation | $187K |
| 90% Confidence Interval | [$205K, $815K] |
The histogram shows the distribution of Personal Lifetime Wealth (Age 30, 1% Treaty) across 10,000 Monte Carlo simulations. The CDF (right) shows the probability of the outcome exceeding any given value, which is useful for risk assessment.
For detailed analysis of personal wealth calculations, see Disease Eradication Model: Personal Lifetime Wealth.
Comparative Effectiveness
This section compares a 1% treaty/decentralized framework for drug assessment system to best-in-class health interventions across multiple categories.
Comprehensive Comparison
| Intervention Type | Metric | Performance | Annual Benefit |
|---|---|---|---|
| 1% Treaty/dFDA | Cost per life saved | $1.1M profit | |
| 1% Treaty/dFDA | Cost per QALY | $0.126 (cost-dominant) | 7.94B QALYs |
| Childhood Vaccinations | Annual benefit | Self-funding | ~$15B |
| GiveWell Top Charities | Cost per life saved | $3.50K-$5.50K | Variable |
| GiveWell Top Charities | Cost per QALY | $3.50K-$5.50K | Variable |
| Smoking Cessation | Annual benefit | Billions | Billions |
| Water & Sanitation | Annual benefit | Hundreds of millions | Hundreds of millions |
| Cancer Screening | Cost per QALY | $20,000-$50,000 | Variable |
| Cardiovascular Prevention | Cost per QALY | $10,000-$30,000 | Variable |
| Medicare/Medicaid Expansion | Cost per QALY | $50,000-$100,000 | Variable |
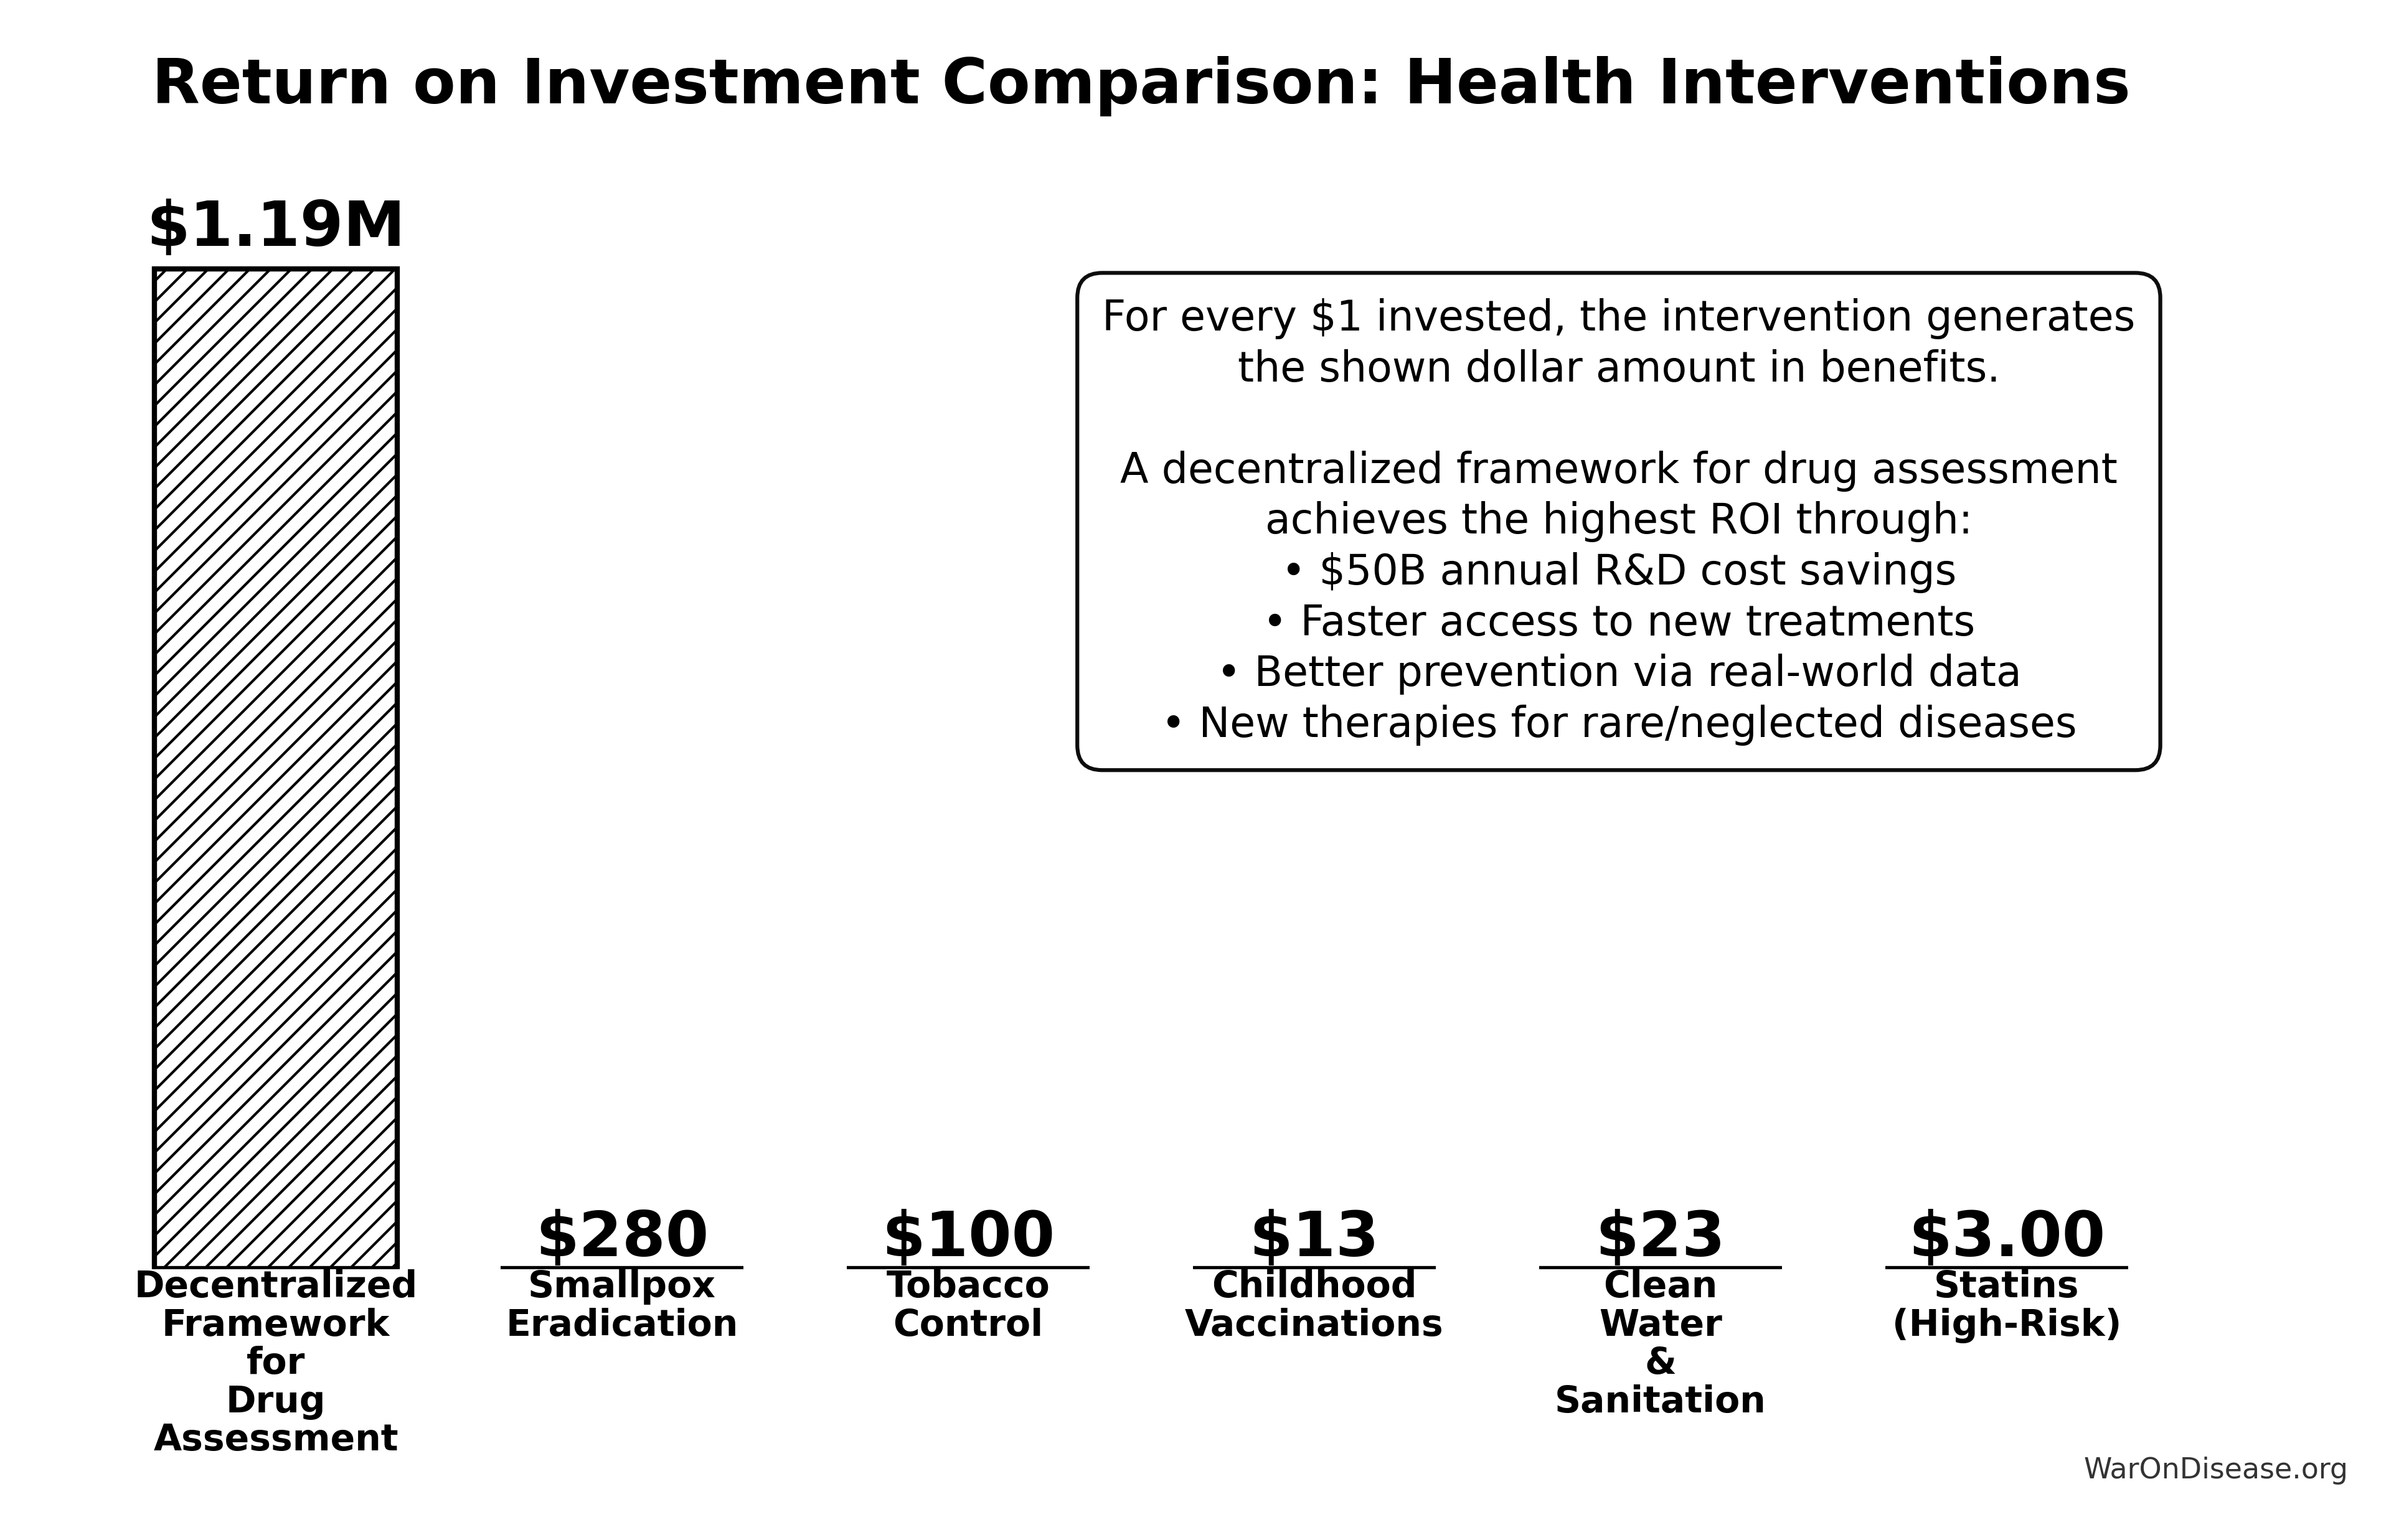

Linear vs. Systemic Leverage
Standard interventions (Bed Nets, Vaccines) are linear: to save 2x more lives, you need 2x more money. They compete for a fixed pool of philanthropic capital.
A 1% treaty is systemic and exponential:
- Negative Cost: It unlocks a new funding source (military waste) that generates profit, effectively having an infinite ROI compared to spending existing capital.
- Multiplier Effect: It accelerates the rate of cure discovery for all diseases (25x acceleration), compounding benefits over time.
The Critical Difference
GiveWell charities are the best ways to spend money saving lives. They’re heroic and incredibly efficient.
This doesn’t spend money. It generates profit while saving lives.
Translation
- Best charity: Costs $3.50K-$5.50K per life saved (excellent)
- This system: Makes $1.1M profit per life saved
One requires infinite fundraising from finite donors. The other prints money while curing diseases.
Both are good. One breaks the usual economic rules.
Why this is different from other interventions:
Vaccines and smoking cessation programs solve specific problems with high returns; they’re amazing interventions.
The 1% Treaty pays for itself by solving two problems at once:
- The Peace Dividend ($114B annually) - created simply by reducing global conflict spending 1%
- Pragmatic trial infrastructure - uses a fraction of that dividend to fix the system of medical research, generating a second massive win
When you redirect the world’s largest source of waste (conflict spending) to fund its most impactful opportunity (pragmatic clinical trials), the math gets wild.
Scale: Conservative benefits ($155B annually) exceed childhood vaccinations by 10.3×.
For detailed comparisons, see Intervention Comparison Table.
Who Benefits and How
The 1% Treaty creates positive economic incentives across all major groups, eliminating traditional opposition to healthcare system reform. This alignment makes it politically feasible and sustainable.
Who Gets What (see Aligning Incentives for details):
- Defense sector: Keeps 99% of current budget
- Pharmaceutical industry: Trial costs shift from expense to revenue (patients fund participation); research capacity increases 22.8×
- Insurance companies: Net savings from reduced disease burden ($109T current economic cost)
- Healthcare providers: More treatment options; earlier access to effective therapies
- Patients: Access to clinical trials as healthcare and new treatments years or decades sooner
- Taxpayers: Net reduction in taxes and healthcare costs through improved R&D efficiency
See Aligning Incentives for detailed analysis and implementation strategy.
Adoption Dynamics: Game-Theoretic Analysis
Western economies are facing a solvency crisis driven by healthcare inflation and aging populations.
- Austerity (cutting benefits) is political suicide.
- Printing Money (MMT) is inflationary suicide.
- The Third Option: Technological Deflation.
By collapsing the cost of clinical trials by 82x, we fundamentally alter the cost structure of healthcare. We replace expensive “chronic disease management” with cheap “curative interventions.” This is the only mathematically viable path to long-term fiscal solvency for G7 nations. It is impossible not to fund this, because the alternative is national bankruptcy.
Implementation Strategy
The economic benefits outlined above demonstrate the value proposition of the 1% Treaty system. Implementation requires political mobilization to achieve treaty adoption:
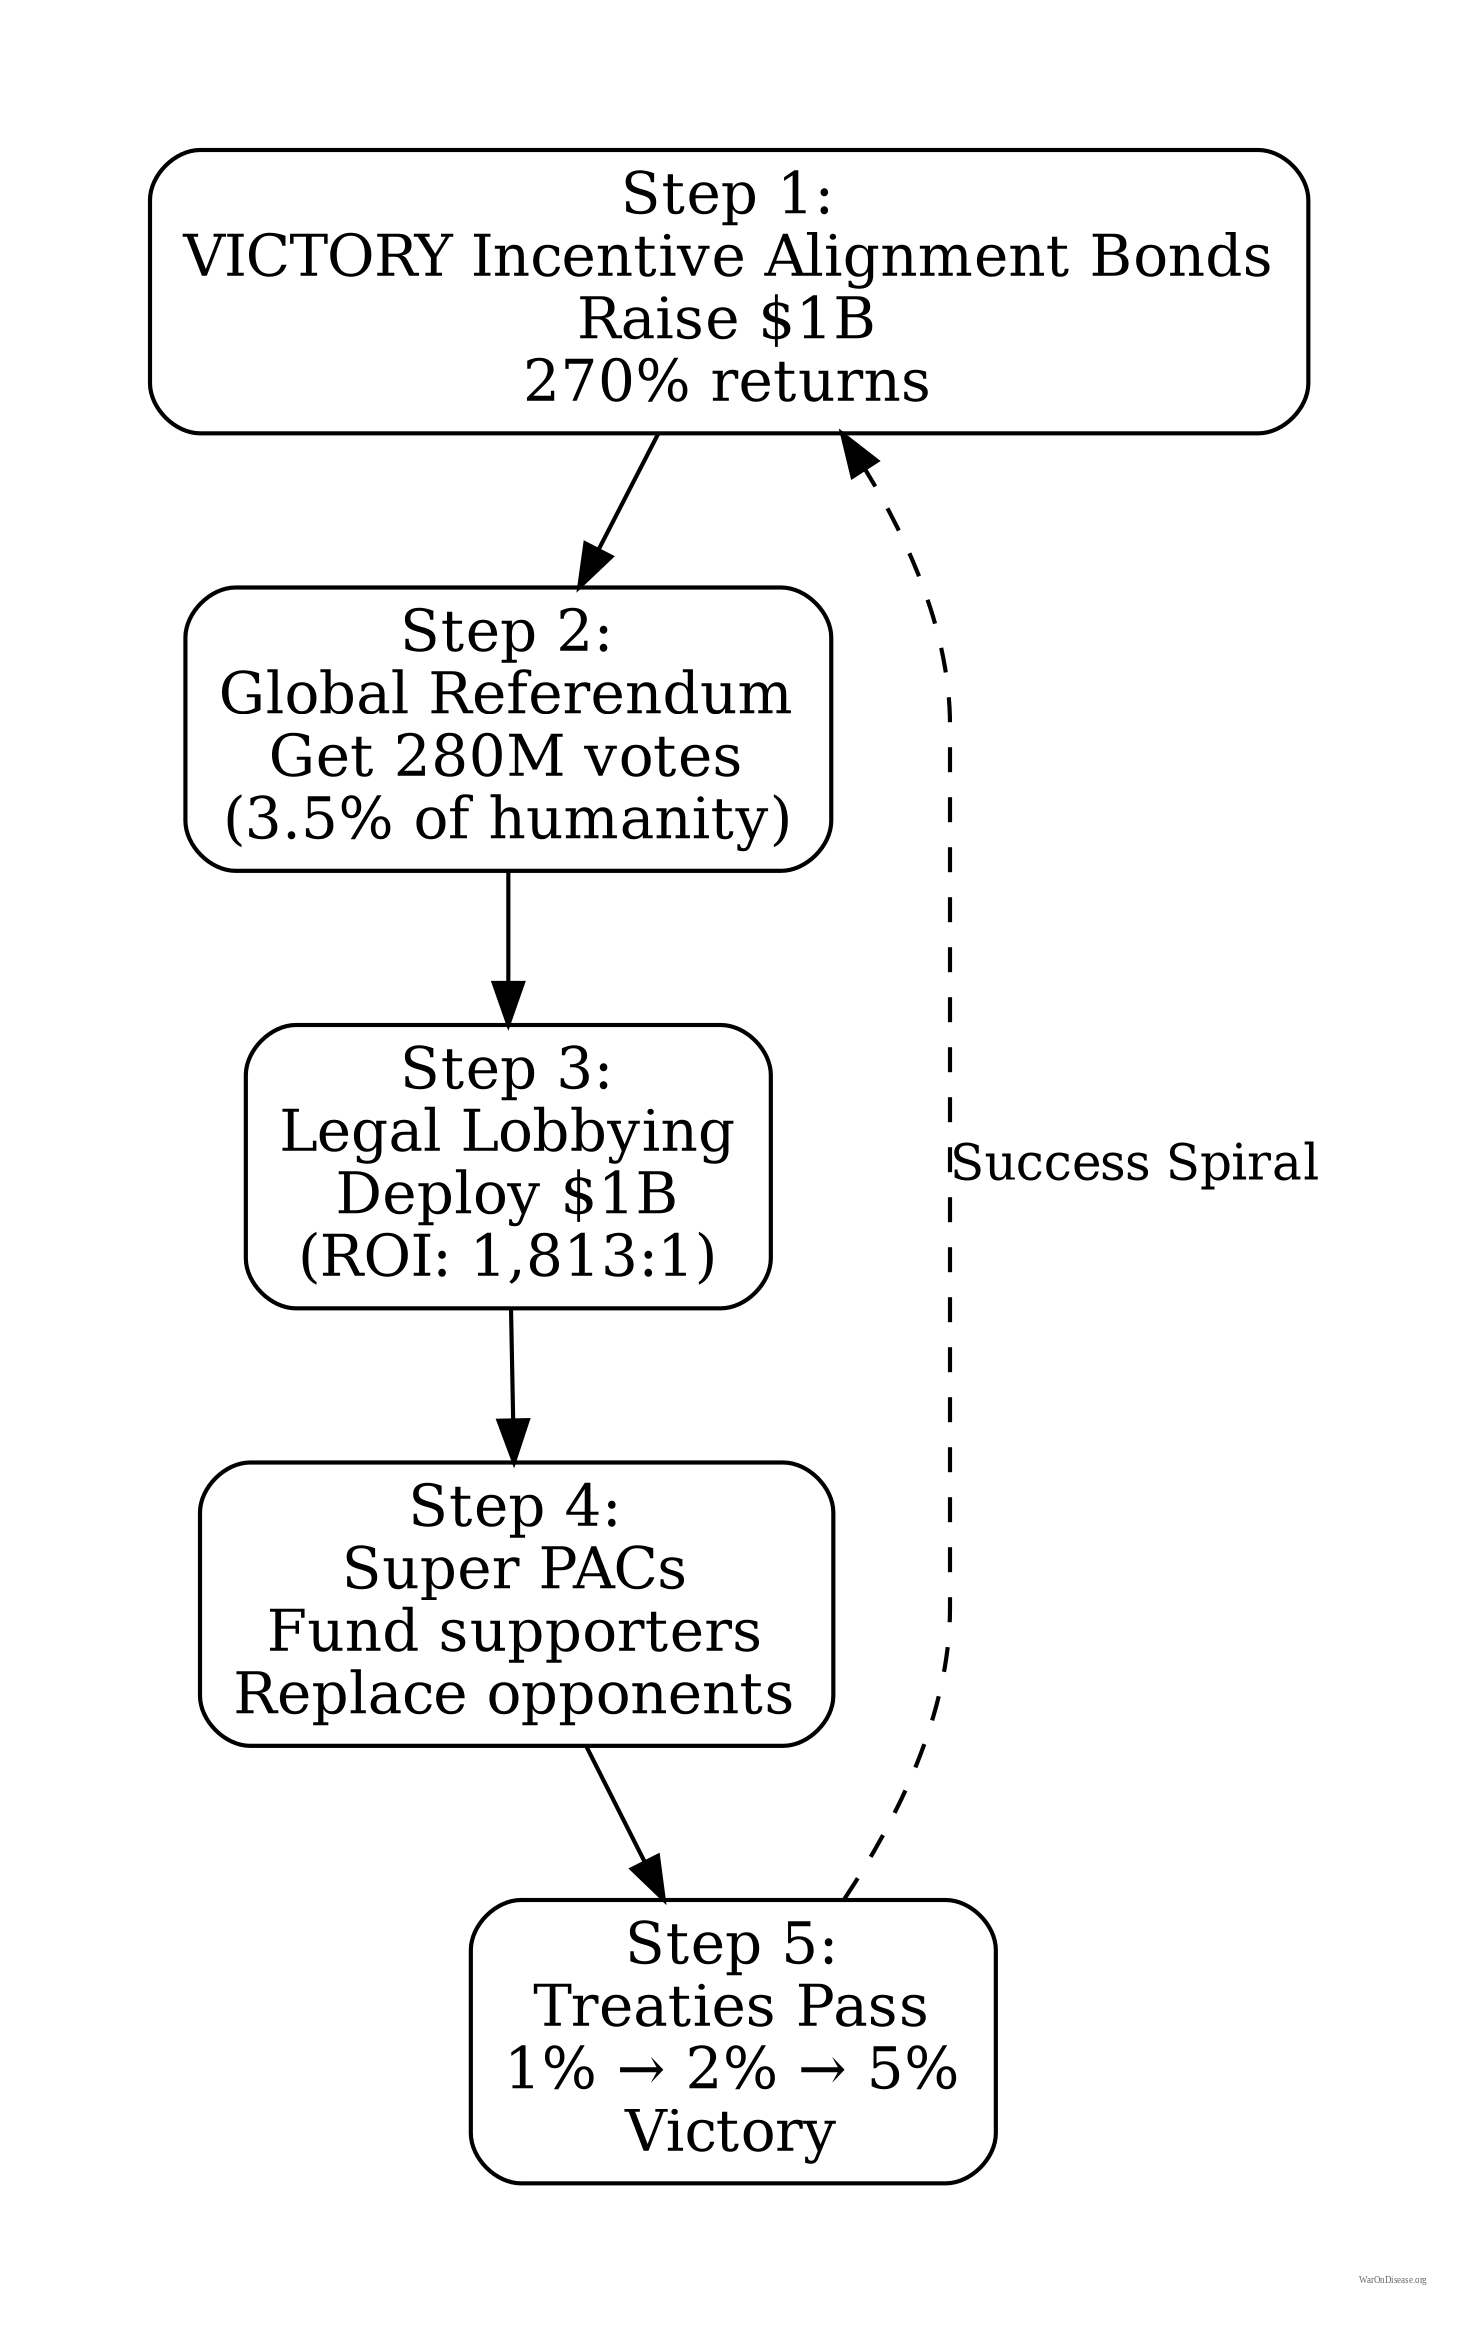
Step 1: Global Mandate (The Philanthropic Catalyst)
Goal: Survey 3.5% of the global population (280M people).
Why 3.5%?: Historical analysis (Chenoweth et al.) proves that no government has ever withstood nonviolent civil challenge from 3.5% of its population. This “Shadow Mandate” creates the political inevitability required to ratify the treaty.
Funding: This educational and scientific polling initiative is the primary entry point for philanthropic partners, validating global demand before the main campaign begins.
Step 2: Sell $1B in VICTORY Incentive Alignment Bonds
VICTORY Incentive Alignment Bond investors fund the campaign because the returns exceed comparable investment opportunities. They’re buying $272% in returns for every $100 invested. It’s the Louisiana Purchase of medical research.
Step 3: Implment the Legislative Strategy
Deploy VICTORY Incentive Alignment Bond funds to translate public support into legislative action. Strategic advocacy, just pointed at curing diseases instead of making bombs.
Step 4: Build the Infrastructure
The 1% shift funds globally scaled pragmatic trial infrastructure modeled on RECOVERY’s approach. Thousands of neglected treatments finally get tested. Effective ones scale instantly.
Technical requirements: Building this requires EHR interoperability, data standards, automated analysis pipelines, and regulatory framework updates. RECOVERY demonstrated the core model works; scaling requires infrastructure investment but no fundamental technical breakthroughs. The challenge is deployment and adoption, not invention.
Step 5: Eradicate Disease
- Medical progress accelerates 22.8×
- Disease categories start collapsing
- Healthspan overtakes pathology
- Investors profit massively
- Governments save money
- Everyone becomes healthier, safer, richer
The plan works because every step is economically rational for everyone involved. Nobody needs to be convinced. They just need to count.
Implementation complexity: Coordinating global treaty adoption, building technical infrastructure, and integrating with existing health systems presents significant logistical challenges. However, these are coordination problems with aligned incentives, not conflicts of interest. Similar to how nations coordinated on the Montreal Protocol (ozone layer) or the International Space Station despite complexity, the economic case makes cooperation rational even for self-interested actors.
For comprehensive implementation details, see:
- Campaign Budget - Detailed breakdown of political mobilization costs
- VICTORY Incentive Alignment Bonds - Financing mechanism for ratification efforts
- Financial Plan Overview - Complete fundraising, spending, and treasury management framework
Campaign Budget Breakdown
The $1B campaign cost (used as denominator in complete case 1.19M:1 ROI) allocates funds across three strategic categories:
| Budget Category | Amount | Purpose |
|---|---|---|
| Global Referendum | Global direct democracy campaign (280M votes). Creates a “Shadow Mandate” and political cost for non-adoption. Not legally binding, but politically coercive. | |
| Legislative Advocacy | Legislative outreach (US/EU/G20), policy education, defense industry conversion, legal/compliance, opposition research. Outspends pharma + MIC combined | |
| Reserve Fund | Post-victory transition, treaty implementation support, contingency buffer | |
| Total Campaign Cost | $1B | 4-year implementation timeline |
Philanthropic Leverage Ratio (The Double Multiplier): For a philanthropic partner, the leverage works in two phases:
- Phase 1 (The Catalyst): Your $100M grant for the Global Survey provides the proof-of-demand that de-risks the private capital raise. (Your money unlocks the $1B bond market).
- Phase 2 (The Outcome): That $1B campaign unlocks $27.2B/year in public funding.
Total Leverage: Your $100M catalyst effectively unlocks a $27B/year revenue stream for global health. This is a 270x annual return on philanthropic capital.
This budget is designed for a 3-5 year campaign to achieve treaty ratification by major powers, representing less than 4% of the first year’s conservative benefits ($155B). The referendum component isn’t a “magic wand”; it’s a mechanism to generate the political capital required to force the treaty onto the agenda of sovereign nations.
This economic analysis focuses on the return on investment once the system is operational, demonstrating that the intervention generates 451:1 to 1.19M:1 returns regardless of the specific path to adoption.
Detailed Technical References
For the rigorous analysis:
- dFDA Cost-Benefit Analysis - The complete 451 ROI breakdown with NPV calculations
- Health Dividend - Accessible overview of the 451 ROI
- Economic Value of Accelerated Treatments - The 7-year access acceleration math
- Economic Models Notebook - All calculations you can verify yourself
- 1% Treaty Cost-Effectiveness - Why this is a dominant health intervention
Risk Analysis and Mitigation
This section addresses common objections and potential failure modes, along with specific mitigation strategies.
The “But Politicians Won’t Do It” Problem
What could go wrong: Politicians refuse to redirect 1% of military spending to pragmatic clinical trials because defense contractors oppose the change.
Why this actually won’t happen:
Defense lobbyists currently get $1,813 back for every $1 spent on political influence. You’re offering VICTORY Incentive Alignment Bond holders ~272% annual returns in perpetuity (allocating 10% of the $27.2B annual inflows to bond payouts).
This creates a financial “kill switch”: if the treaty is not respected, this massive income stream stops. This aligns the most powerful interests on earth with treaty compliance.
Budgetary Reality: The Pentagon has failed its sixth consecutive audit and cannot account for $2.5 trillion in assets. A 1% reduction is statistical noise in a system that can’t locate trillions. It doesn’t require firing people or closing factories; it requires accounting for rounding errors.
When you show powerful people a spreadsheet where they keep 99% of their current contracts PLUS get massive perpetual returns on bonds, they stop lobbying against you and start lobbying for you.
You’re not defeating greed. You’re aligning economic incentives to direct existing profit motives toward pragmatic clinical trials.
The “Moral Hazard” of Inaction: We quantified the cost of delay ($1.2Q), but the liability is personal. Leaders who reject this are effectively signing death warrants for their own voters, donors, and family members.
If politicians fail to adopt the treaty and enable this 25X increase in clinical trial capacity and shift forward in the availability of life-saving treatments, they are technically responsible for the 416M deaths that will occur during the 8.2-year delay they chose not to eliminate. In the information age, this choice will be public, tracked, and politically weaponized. Voting “No” isn’t just a budget decision; it’s a career-ending legacy of preventable mass death.
Historical precedent: After WW2, military spending was cut by 30% Wikipedia (2020), contributing to substantial economic growth. The proposed 1% reduction is significantly more modest.
See Treaty Adoption Strategy for detailed implementation strategy.
Safety Concerns
Objection: Decentralized trials may miss dangerous side effects.
Response: The current system is flying blind. It barely collects and does not systematically publish adverse event rates for most treatments.
A decentralized framework for drug assessment (dFDA) system improves safety by:
- Mandating Data Collection: The system collects and publishes outcome labels on the frequency and magnitude of all health outcomes. We have nothing like this today.
- Continuous Monitoring: Pragmatic trials with larger samples and continuous monitoring detect safety problems faster than traditional trials.
- Preserving Phase I: A dFDA retains rigorous Phase I safety testing (~2.3 years), which successfully prevented the Thalidomide disaster in the US.
What changes: Eliminating the 8.2 (BIO) (2021)-year efficacy delay AFTER safety is proven. You still can’t sell poison. You just don’t have to wait 8 years to prove aspirin helps headaches AFTER you’ve already proved it doesn’t kill people.
Superior safety surveillance:
| Safety Dimension | Traditional Trials | Pragmatic Trials |
|---|---|---|
| Sample size | 100-300 patients | 10,000-100,000+ patients |
| Patient selection | 86.1% excluded (comorbidities, age, medications) | All volunteers included |
| Monitoring duration | 3-12 months | Continuous through EHR integration |
| Publication | ~50% unpublished; positive 3× more likely | 100% automatically published |
| Subpopulation testing | Excludes elderly, children, pregnant patients | Tests all populations |
Empirical validation: The RECOVERY trial tested 6 treatments on 47,000 patients in 3 months at $500 per patient, identifying effective treatments (dexamethasone) and ruling out harmful ones (hydroxychloroquine) faster than traditional trials.
Historical evidence: Long-term Benadryl dementia risk went undetected for 40+ years under current surveillance. Continuous EHR monitoring would detect such effects in 2-3 years.
Type II error dominates: Regulatory mortality analysis shows 3.07k:1 harm ratio: for every person saved by preventing unsafe drug approval, 3.07k people die waiting for approval of beneficial treatments.
The current regulatory framework prevents some harms but causes far more deaths through delay. While Phase I safety testing successfully prevents toxic compounds from reaching patients (Type I errors), the barriers the 1962 law places between patients and beneficial treatments cause 3.07k× more deaths than they prevent (Type II errors). Regulatory mortality analysis calls this the “Invisible Graveyard”: 416M deaths (1962-2024) from the 8.2-year delay between safety verification and final approval.
For detailed analysis, see Regulatory Mortality Analysis.
Patient Agency and Autonomy
A decentralized institutes of health put patients in control through trial participation, not committee votes.
Current system: 200 NIH bureaucrats decide what 8.00B humans can try when dying
New system: Patients choose which trials to join. Trials that attract patients get funded. Trials that don’t, die.
Your subsidy follows you to whichever trial you join. Researchers compete to design trials that patients actually want to participate in. No committees, no grant-writing contests, no bureaucrats deciding what’s “worthy” of study.
All transactions publicly recorded. All spending transparent. All decisions auditable.
Patients select which trials to join. Trials that attract participants receive funding. Researchers compete for patient participation rather than committee grants.
The system operates through distributed infrastructure:
- Open-source protocols (anyone can verify how it works)
- Distributed validation (no single point of failure)
- Works with existing regulators (additive layer, not replacement)
Accountability measures
- Annual third-party audits of 1% Treaty Fund and dFDA operations
- Public reporting of all spending and outcomes
- Milestone-based funding (money releases when targets hit)
See Governance and Accountability and Legal Structure for the complete system that prevents this from becoming another bureaucratic nightmare where nothing happens and everyone dies while committees meet.
Limitations and Uncertainties
This analysis acknowledges several important limitations and sources of uncertainty inherent in modeling a transformative policy intervention of this scale.
Adoption Timeline Uncertainty
The base case assumes gradual adoption over 5 years to full implementation. Actual adoption may be faster or slower depending on:
- Regulatory harmonization: International coordination requirements may extend implementation timelines
- Technical infrastructure readiness: EHR interoperability, data standardization, and privacy compliance vary significantly across jurisdictions
- Industry cooperation: Pharmaceutical companies, regulators, and healthcare providers will resist or accelerate adoption based on whether they profit from it
Sensitivity analysis addresses this: Worst-case scenario models extended timelines with ROI remaining positive (66:1) even under pessimistic assumptions.
Cost Reduction Assumptions
The 50% baseline R&D cost reduction derives from the Oxford RECOVERY trial’s demonstrated 82 M. Institute× efficiency gain. However:
- Trial complexity variation: The RECOVERY trial focused on repurposed drugs for acute conditions; novel therapeutics for chronic diseases may not achieve equivalent cost reductions
- Regulatory requirements: Some trial phases (particularly safety studies) may retain higher costs regardless of decentralization
- Geographic variation: Cost reductions may be greater in high-cost jurisdictions (U.S., Europe) and lower in regions with already-efficient trial systems
Conservative approach: Analysis uses 50% reduction (midpoint) rather than the demonstrated 95%+ efficiency gains, providing substantial margin of safety.
Generalizability from RECOVERY Trial and Historical Precedent
The analysis relies significantly on the Oxford RECOVERY trial as empirical evidence for cost reductions (82× efficiency gain). Potential concerns about generalizing from a single case study are addressed through historical context:
Historical validation: The physician-led pragmatic trial model has 77 years of empirical validation (1883-1960), not merely one modern case study. 144k physicians tested treatments on real patients in routine practice before the 1962 regulatory shift.
Trial complexity variation: RECOVERY studied repurposed drugs (dexamethasone, hydroxychloroquine) for acute COVID-19 treatment. Novel therapeutics for chronic diseases may face different challenges. However:
- Conservative estimate uses 50-70% cost reduction (not the 95%+ demonstrated by RECOVERY)
- Pre-1962 system achieved similar efficiencies across diverse therapeutic areas (not limited to repurposed drugs)
- Pragmatic trial literature consistently shows 50-95% cost reductions across multiple contexts
Conclusion: While RECOVERY provides modern validation, the fundamental approach (decentralized physician-led efficacy testing) has extensive historical precedent suggesting generalizability beyond single case studies.
Diminishing Returns in Research Productivity
Economic literature documents declining research productivity over time. Bloom et al. (2020) show research productivity falling ~5% annually across industries, with Moore’s Law requiring 18× more researchers than in the 1970s to achieve constant improvement rates.
Why this critique may not apply
This intervention targets a different margin than traditional research scaling. Bloom et al. measure idea productivity (breakthroughs per researcher-year). Our intervention targets trial execution efficiency (cost per patient enrolled, completion rates, recruitment speed).
Distinction
- Bloom et al.: Diminishing returns to discovery of new ideas (fundamental scientific breakthroughs getting harder to find)
- dFDA model: Improving execution of existing trial designs (streamlining data collection, not discovering new biology)
The Myth of Diminishing Returns
The argument that medical research faces diminishing returns rests on a false premise: that we have already picked the “low-hanging fruit.” In reality, we haven’t picked the fruit because we can’t afford the ladder.
High trial costs (median ~$41,000 per patient) force researchers to bet only on “sure things,” leaving the vast majority of the therapeutic map blank.
1. The Immediate Opportunity (Existing Safe Drugs)
Even restricting ourselves to compounds humans already know are safe (FDA-approved drugs and GRAS substances), we have barely scratched the surface.
- Safe compounds available: 9.50k (FDA approved + GRAS)
- Diseases to treat: 1.00k (trial-relevant ICD-10 codes)
- Possible combinations: 9.50M plausible drug-condition pairs
- Actually tested: 32.5k (estimate)
We can express the exploration gap mathematically as:
\[ \text{Exploration Ratio} = \frac{N_{tested}}{N_{compounds} \times N_{diseases}} \approx \frac{50,000}{12,000 \times 1,000} \approx 0.417\% \]
We have empirically tested 0.342% of the drug-disease relationships possible using existing, approved, safe compounds. The other 99.7% remains unexplored due to transaction costs. See The Untapped Therapeutic Frontier for full analysis.
Uncertainty Analysis
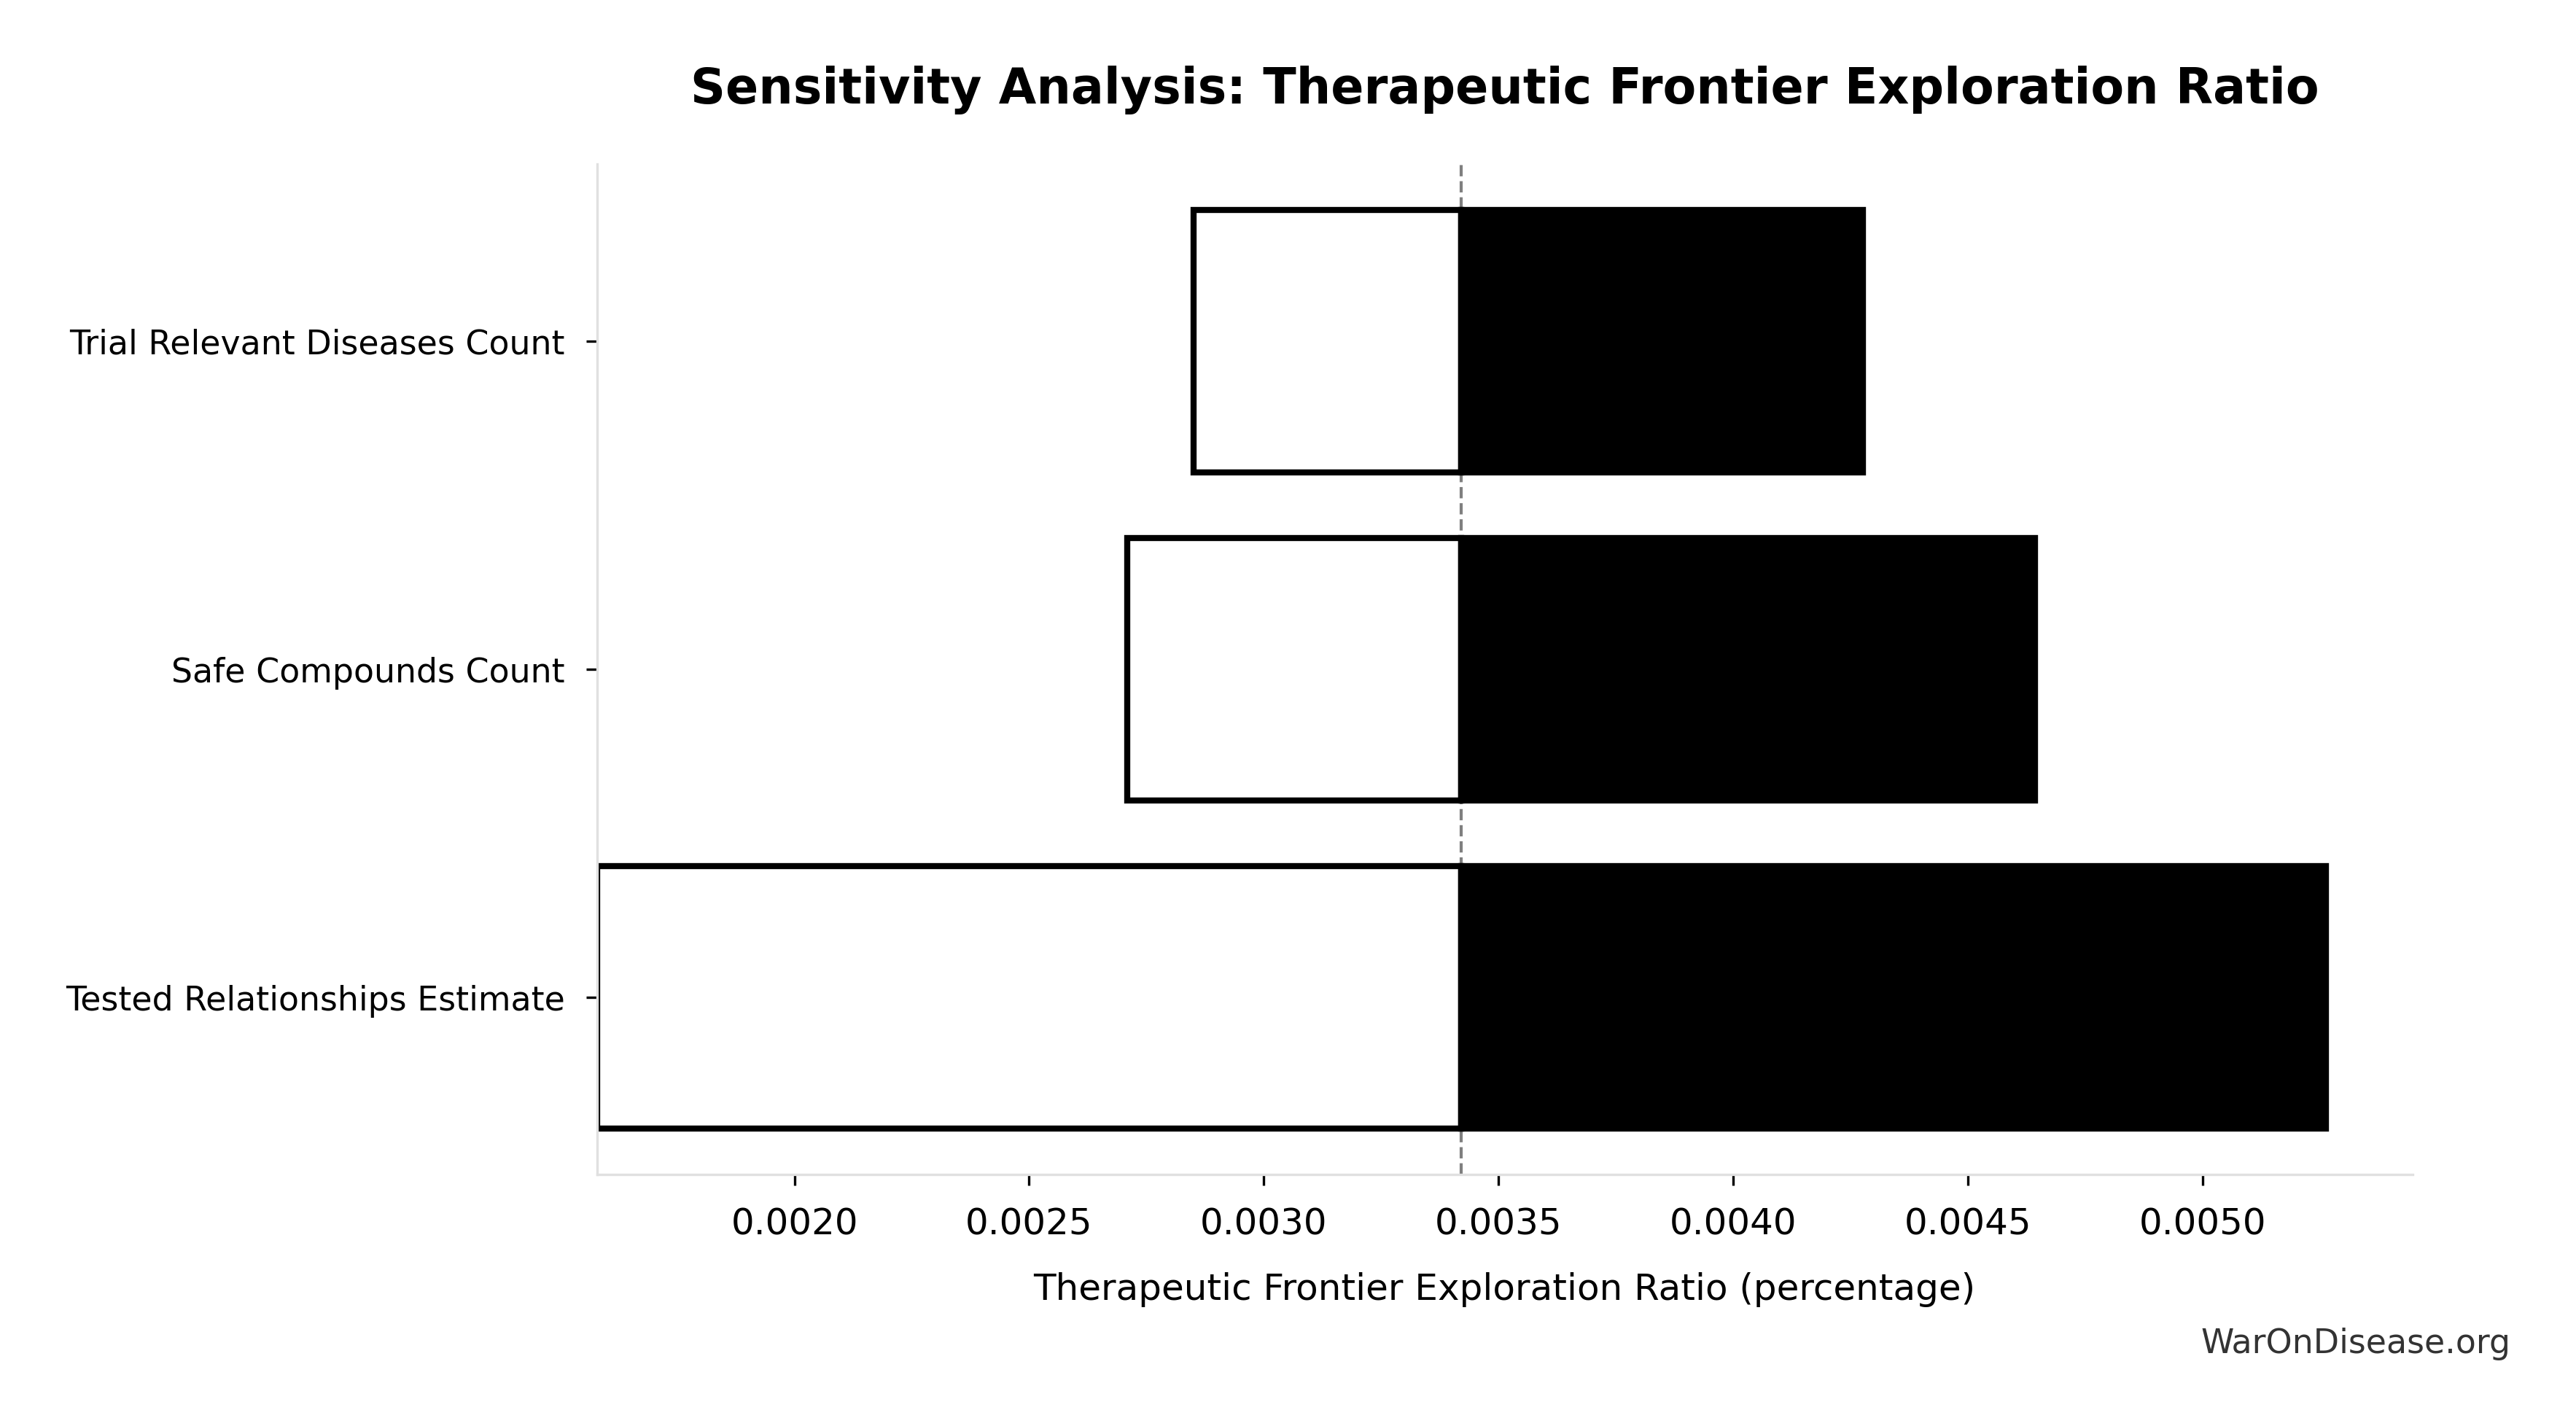
The tornado diagram shows that estimates of tested relationships dominate the uncertainty in our exploration ratio calculation. Even under conservative assumptions (upper bound of tested relationships), humanity has explored less than 1% of the therapeutic space.
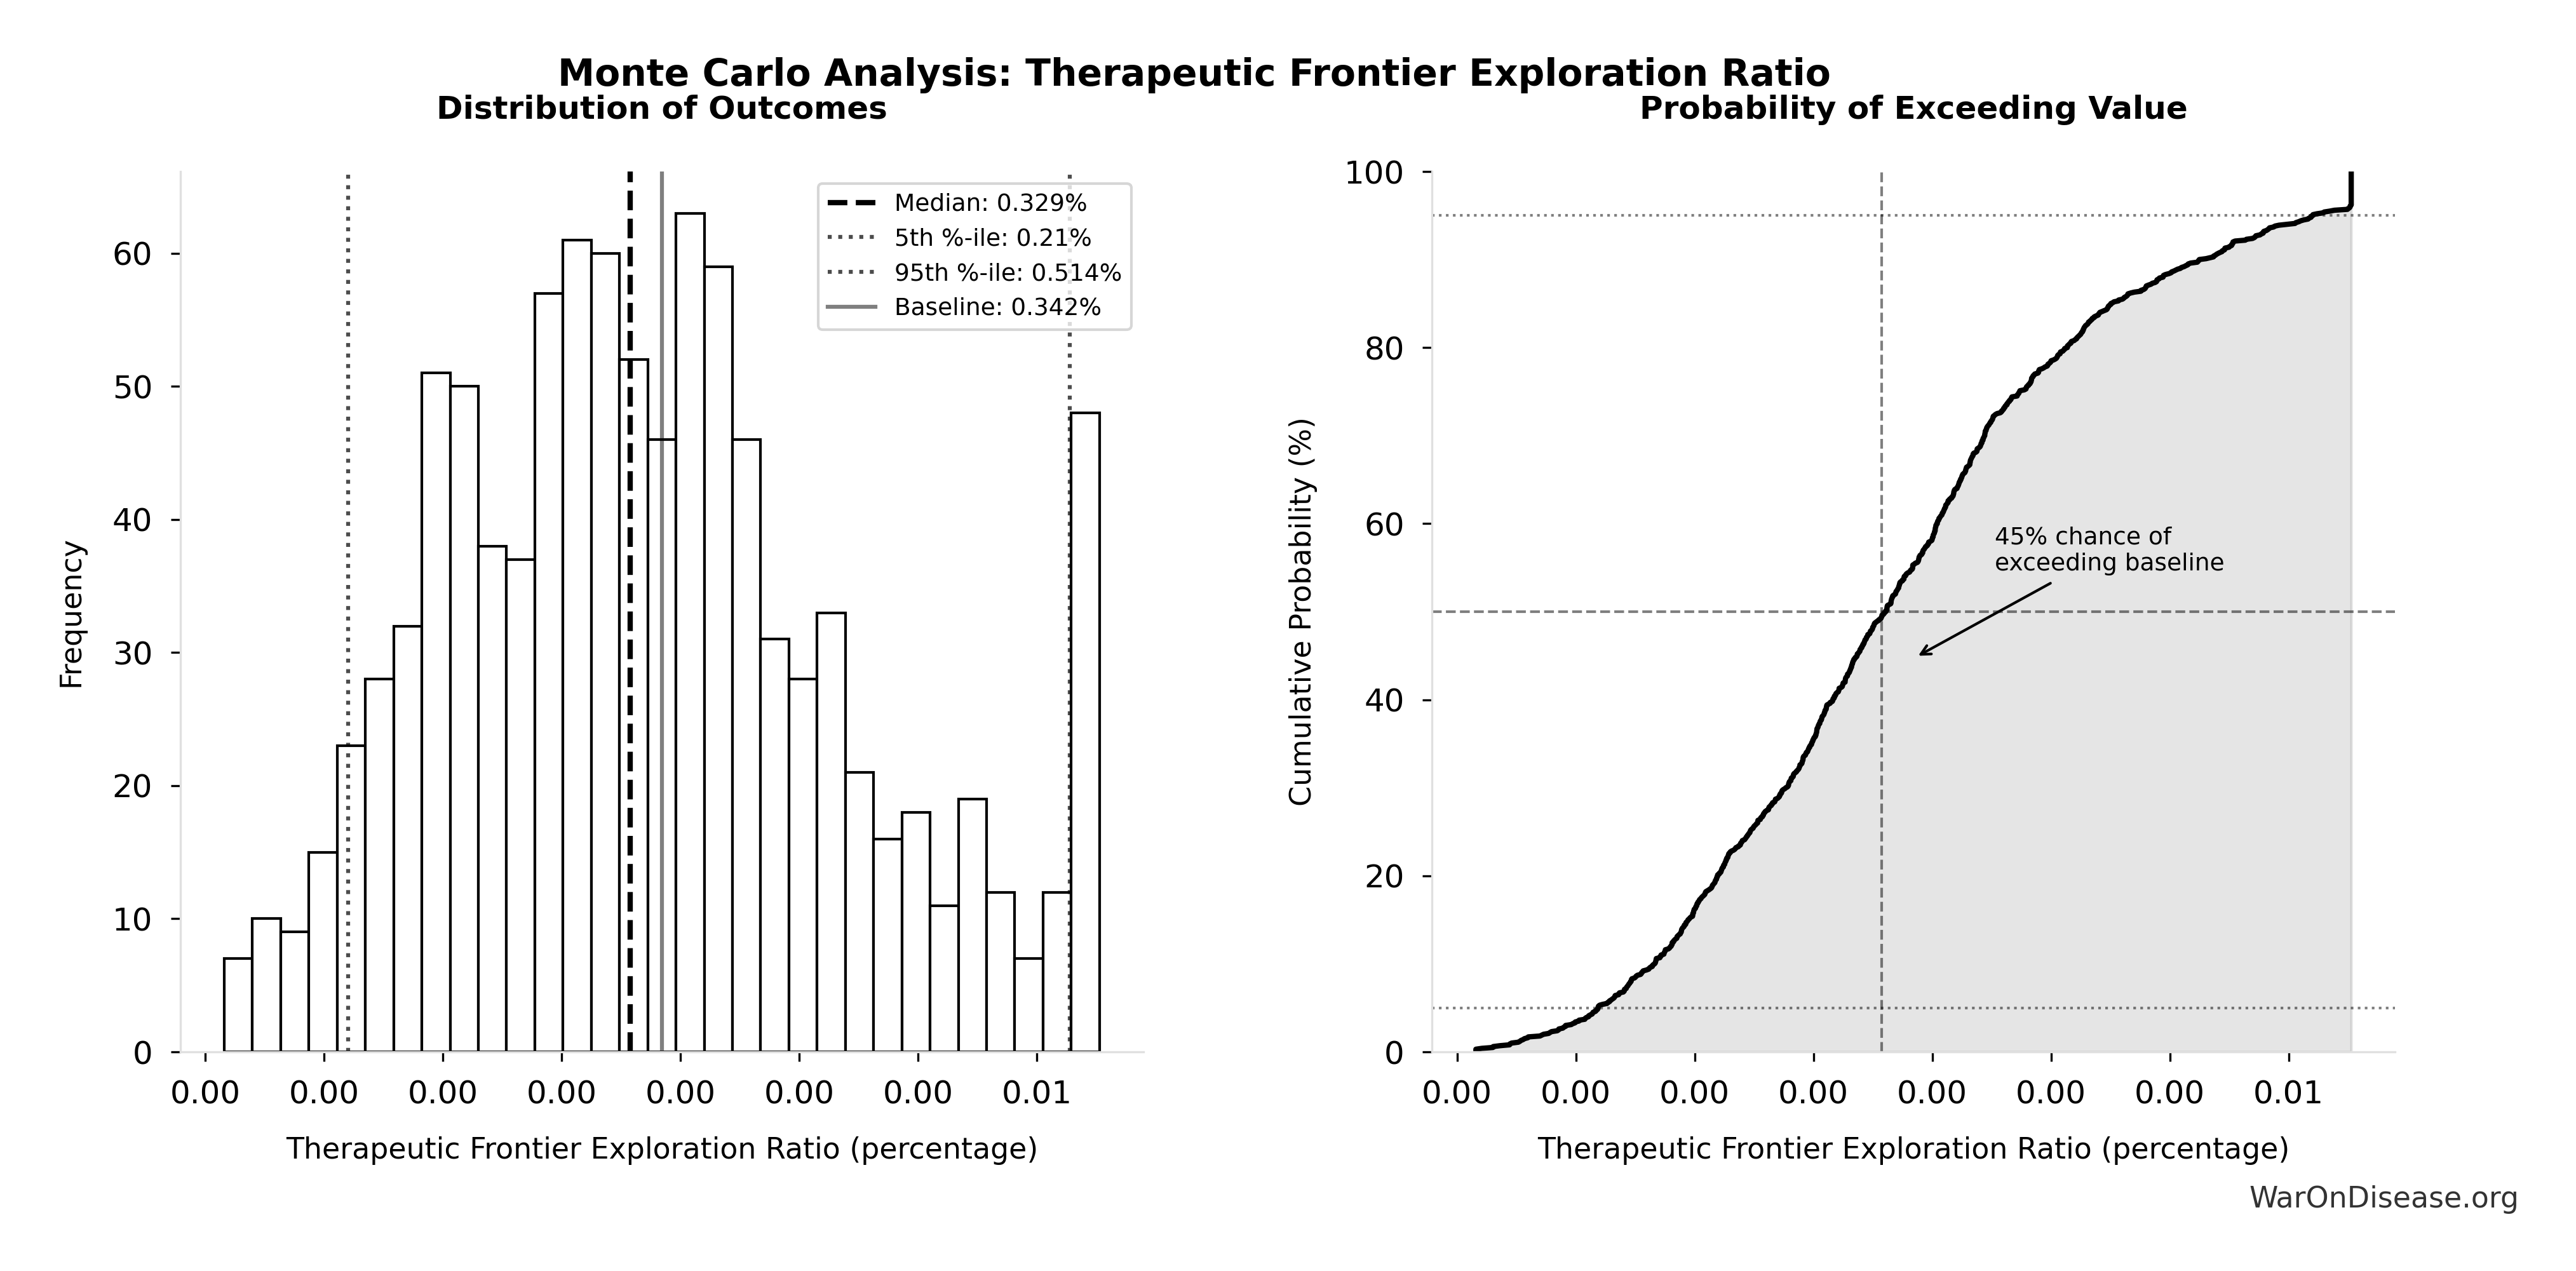
Simulation Results Summary: Therapeutic Frontier Exploration Ratio
| Statistic | Value |
|---|---|
| Baseline (deterministic) | 0.342% |
| Mean (expected value) | 0.339% |
| Median (50th percentile) | 0.329% |
| Standard Deviation | 0.0868% |
| 90% Confidence Interval | [0.21%, 0.514%] |
The histogram shows the distribution of Therapeutic Frontier Exploration Ratio across 10,000 Monte Carlo simulations. The CDF (right) shows the probability of the outcome exceeding any given value, which is useful for risk assessment.
Monte Carlo simulation across 10,000 trials confirms robustness: even accounting for uncertainty in all input parameters (safe compounds, diseases, tested relationships), the median exploration ratio remains well below 1% with high confidence.
2. The Ultimate Frontier (New Molecules)
If we look beyond existing drugs to the broader chemical space (10^23 to 10^60 molecules), humanity has explored roughly one-quintillionth of what is possible.
We haven’t hit the limits of biology; we’ve hit a cost wall. Reducing trial costs by 82x makes it economically viable to systematically explore this “dark matter” of medicine.
Empirical evidence for efficiency gains: RECOVERY trial and pre-1962 physician-led system both achieved 80-95% cost reductions by eliminating overhead (redundant monitoring, bespoke infrastructure, excessive documentation), not by making scientific discoveries easier.
Sensitivity: Even applying 50% diminishing returns adjustment to research acceleration estimates, ROI remains 230:1 (conservative) to 620:1 (complete). The intervention remains cost-effective under pessimistic productivity assumptions.
Pragmatic Trial Internal Validity and Selection Bias
Decentralized trials with broad eligibility criteria face potential selection bias concerns. Traditional randomized controlled trials use restrictive eligibility precisely to control confounding and establish internal validity.
Trade-off between internal and external validity: Patsopoulos (2011) documents that pragmatic trials often find 15-25% smaller effect sizes than explanatory trials but offer superior external validity (generalizability to real-world populations).
Mitigation strategies
- Randomization preserved: A decentralized framework for drug assessment (dFDA) maintains random treatment assignment (the core causal identification strategy)
- Large sample sizes: Decentralized recruitment enables 10-100× larger trials, improving statistical power and subgroup analysis
- Covariate adjustment: Electronic health record data enables controlling for confounders ex-post using propensity score matching and instrumental variables
- Replication at scale: Lower costs enable rapid replication across diverse populations, testing robustness
Empirical evidence, observational studies produce valid results: A meta-analysis in the New England Journal of Medicine compared effect sizes from high-quality observational studies to randomized controlled trials across multiple interventions. The findings demonstrate that well-designed observational studies produce results statistically indistinguishable from expensive RCTs.
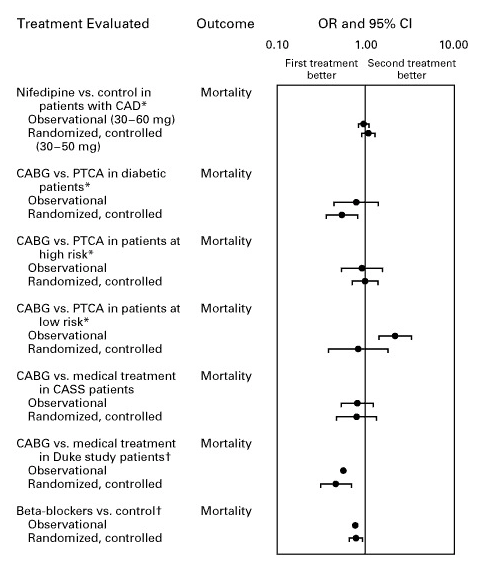
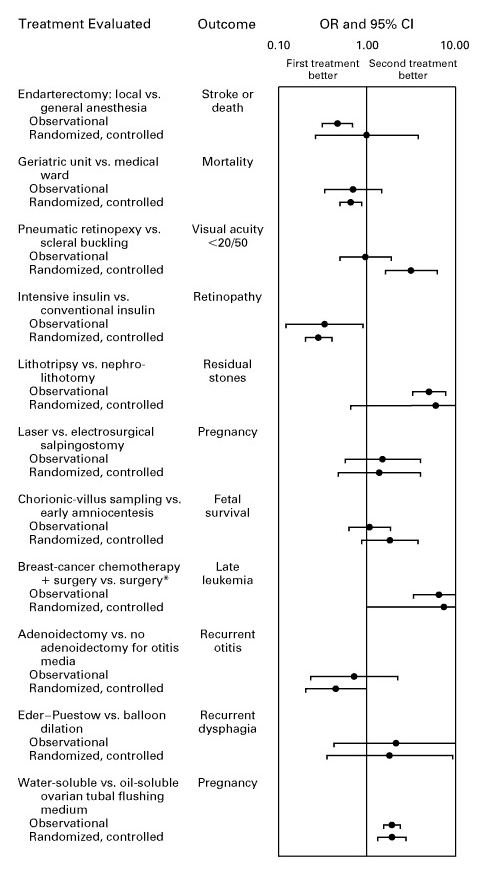
These meta-analytic findings support the validity of pragmatic trial designs used in a dFDA model. Modern statistical methods, large sample sizes, and proper covariate adjustment enable observational and quasi-experimental designs to achieve causal inference comparable to traditional RCTs at a fraction of the cost.
Historical precedent: Pre-1962 physician-led system successfully identified effective treatments (antibiotics, vaccines, surgical techniques) despite lacking modern randomization, suggesting real-world evidence can establish causality when combined with peer review and replication.
Publication bias: Traditional trials face severe publication bias: only 37% of negative results are published compared to 94% of positive results, leading to overestimation of treatment effectiveness and ~$100 billion annually wasted on repeating failed experiments. A decentralized framework for drug assessment system addresses this by design: all trials are registered in the public database, all results (positive and negative) are automatically published through the transparent data infrastructure, and the open data architecture ensures no selective reporting. Unlike traditional systems where researchers choose what to publish, a decentralized framework for drug assessment’s mandatory publication of all registered trials eliminates publication bias as a concern.
Conclusion: Internal validity concerns are acknowledged, but the combination of randomization, large samples, and replication capacity provides adequate causal inference even with broader eligibility criteria.
QALY Calculation Uncertainties
The 7.94B annual QALY estimate aggregates three benefit streams with varying levels of empirical support.
Addressing the “Quadrillion Dollar” Assumption: The total economic value of $1.19 quadrillion derives from shifting disease eradication forward by 8.2 years.
This estimate is extremely conservative for three reasons:
- It ignores the 22.8x Research Acceleration: The 8.2-year shift accounts only for eliminating the regulatory efficacy lag (the time wasted waiting for approval after safety is proven). It does not account for the fact that a dFDA system accelerates the pace of research itself by 22.8x. With 22.8x more trials running simultaneously and cost barriers removed, cures would likely arrive decades earlier, not just 8.2 years earlier.
- It assumes a fixed timeline: Even if full biological control takes 1,000 years, shifting that timeline forward by 8.2 years saves 8.2 years’ worth of future lives. Given the trajectory of biotechnology, “eventual” control over biology is a matter of when, not if.
- It works with partial success: Even if we assume 90% of diseases remain biologically incurable (a massive discount), accelerating cures for just the “easiest” 10% of the burden (e.g., cardiovascular disease, metabolic disorders) still yields over $120 trillion in value. The ROI is positive even at 1/100th of the projected success rate.
Stream A (Accelerated Drug Access): High confidence, based on well-documented costs of delayed access (84,000 life-years lost per year delay in cancer therapies alone).
Stream B (Prevention via Real-World Evidence): Medium confidence, preventative care benefits are well-established, but scale of improvement from comprehensive data remains uncertain.
Stream C (Rare Disease Treatments): Lower confidence, economic viability of rare disease research is theoretically sound but empirically unproven at scale.
Conservative approach: Base case uses median estimates across all three streams; sensitivity analysis demonstrates positive returns even at conservative QALY levels (7.94B annually yields 451:1 ROI using R&D savings alone).
Data Limitations
Military Spending Data
Global military expenditure data ($2.72T, SIPRI 2024) is well-documented but:
- Off-budget spending: Some military expenditures may be classified or categorized elsewhere
- Exchange rate fluctuations: Multi-year projections require currency assumptions
- Conflict zones: Military spending in active conflict regions may be less fungible for redirection
Clinical Trial Market Sizing
The $83B Research & Markets (2024) global clinical trials market estimate derives from industry reports, which:
- Industry variation: Methodologies vary across market research firms
- Private vs. public trials: Some trial spending may be unreported or proprietary
- Non-pharmaceutical trials: Medical device and digital health trials may have different cost structures
QALY Valuation Thresholds
Standard willingness-to-pay thresholds ($50K-$150K ICER (2024) per QALY) vary by jurisdiction:
- Geographic variation: WHO recommends 1-3× GDP per capita; high-income countries use higher thresholds
- Ethical considerations: Monetary QALY valuations raise equity concerns
- Discount rates: Future health benefits discounted at 3% may undervalue long-term gains
Generalizability Constraints
Political Feasibility
This analysis models economic returns conditional on treaty ratification. Political feasibility depends on:
- Geopolitical stability: International cooperation requirements may face challenges during periods of global tension
- Domestic politics: Military budget reductions face constituency resistance in defense-dependent regions
- Lobbying influence: Defense industry opposition may impede adoption
Risk assessment: The 1% reduction is intentionally modest to minimize political resistance. Historical precedents (military-to-civilian conversions post-Cold War) demonstrate feasibility.
Institutional Capacity
Implementation requires substantial institutional development:
- Regulatory expertise: A dFDA requires experienced personnel (FDA, EMA, other regulators) to enable integration with existing regulatory frameworks
- Technical infrastructure: Data systems, AI/ML capabilities, cybersecurity at global scale
- Legal frameworks: International treaties, data privacy compliance, intellectual property harmonization
Mitigation: Phased implementation allows capacity building concurrent with scale-up.
Healthcare System Integration
Benefits assume integration with existing healthcare infrastructure:
- EHR interoperability: U.S. and other jurisdictions still face significant interoperability challenges
- Wearable adoption: Real-world data collection requires widespread wearable/digital health adoption
- Provider participation: Clinician buy-in necessary for trial recruitment and data quality
Uncertainty Quantification
Primary Risk Factors
The following table summarizes key risk factors and their mitigation strategies:
| Risk Factor | Level | Primary Uncertainty | Mitigation Strategy |
|---|---|---|---|
| Political Risk | VERY HIGH | Treaty ratification dependent on international coordination | Modest 1% reduction; precedent from military-industrial lobbying ROI (1,813:1) |
| Execution Risk | HIGH | Complex global legal/technical coordination required | Phased implementation; leverage existing regulatory expertise |
| Regulatory Risk | MEDIUM-HIGH | Harmonization across jurisdictions varies | Pilot programs in willing jurisdictions first |
| Market Risk | VERY LOW | $2.72T SIPRI (2025) military spending already allocated | Redirection rather than new appropriation |
| Technical Risk | MEDIUM | Data interoperability, AI/ML accuracy | Build on proven platforms (Medable $521M raised, $2.1B valuation) |
Scenario Analysis Robustness
Comprehensive sensitivity analysis across multiple scenarios demonstrates:
- Risk-adjusted (11.9k:1 expected ROI): Central estimate with political success probability uncertainty (5%-50% range), intervention generates substantial positive returns
- Conservative (451:1 ROI): R&D savings only, excludes peace dividend, intervention is dominant
- Complete (1.19M:1 ROI): All quantifiable benefits, intervention transforms global health economics
Key insight: Even under pessimistic assumptions with multiple adverse conditions simultaneously occurring, the intervention generates positive returns exceeding most established public health programs. The tornado chart for DFDA_EXPECTED_ROI shows that political success probability is the dominant driver of uncertainty.
General Equilibrium Effects
This analysis employs partial equilibrium methodology, holding prices and market structures constant while evaluating the intervention’s direct effects. General equilibrium analysis would account for market adjustments to the $27.2B annual reallocation from military to pragmatic clinical trials spending.
Unmodeled general equilibrium effects include:
Data infrastructure scaling costs: Decentralized trial infrastructure uses automated software (federated queries, not centralized databases), scaling through technology rather than labor. Unlike traditional research that faces researcher supply constraints, the system leverages existing EHR systems (Epic, Cerner) and adds coordination protocols. Marginal scaling costs are low relative to traditional models.
Clinical trial market price effects: Increasing trial demand by 22.8× could affect equilibrium prices for clinical research services. However, the pragmatic trial approach reduces per-trial costs (82× cheaper via automation), suggesting supply constraints may not bind. Traditional trials cost $41K per patient; decentralized trials target $500 per patient by eliminating overhead, not by increasing demand for scarce inputs.
Crowding out effects: Do billions in new pragmatic clinical trials displace existing research funding, or does it add incrementally? Conservative assumption: fully additive. If partially substitutive (e.g., governments reduce NIH funding in response), net research increase would be lower than modeled.
Quality versus quantity trade-off: 22.8× more trials may not yield proportional breakthroughs if resources spread thin or trial quality declines. The analysis assumes quality maintenance through peer review and replication; actual quality effects remain uncertain.
Conservative treatment in base case: The analysis excludes general equilibrium effects from benefit calculations, providing a lower bound estimate.
Methodological limitation acknowledged: Full general equilibrium modeling (computable general equilibrium models with labor markets, international trade, and technology diffusion) would require substantial additional complexity beyond this analysis scope. The partial equilibrium approach follows standard cost-benefit analysis methodology for policy interventions.
Conditional Benefits Interpretation
The ROI estimates (451:1 conservative, 1.19M:1 complete) are conditional on successful implementation, they represent returns if a dFDA operates as designed. Expected value analysis (see “Expected Value Analysis Accounting for Political Risk” section) incorporates probability-weighted scenarios. This section examines operational and technical failure modes that could occur even after political success, complementing the Investor Risk Analysis focus on political barriers. Pilot implementations should monitor false positive rates, adverse event detection sensitivity, regulatory acceptance rates, and industry adoption velocity to enable early course corrections.
Limitations Summary
Despite these limitations, several factors support the analysis’s robustness:
- Conservative assumptions throughout: Base case uses median estimates; optimistic scenarios excluded from primary ROI (451:1)
- Empirical grounding: Cost reductions based on demonstrated RECOVERY trial results, not theoretical models
- Sensitivity analysis: Wide range of scenarios tested; positive returns maintained across all plausible parameter combinations
- Dominant intervention status: Cost-dominant intervention ($0.126 per DALY) means it saves money even if health benefits are substantially overstated
Transparency commitment: All parameters, data sources, and calculation methodologies are publicly documented with confidence levels and last-update dates in Parameters and Calculations Reference and References.
Future research priorities include prospective data collection during pilot implementations, real-world validation of cost reduction estimates, and longitudinal assessment of QALY gains across diverse populations and disease contexts.
Policy Implications
This analysis has direct implications for resource allocation decisions across multiple policy domains:
National Health Budgets
Traditional health budgets face impossible trade-offs: every dollar spent on cancer treatment is a dollar not spent on heart disease prevention. This intervention eliminates that constraint by redirecting funds from outside the health sector.
Key insight: Health ministries can achieve 22.8× more clinical research without reducing current health spending or raising taxes. The funding comes from military budgets, not health budgets.
Practical application: A nation spending $2.72T on military could redirect 1% ($27.2B) to fund pragmatic trials for its entire population while maintaining 99% of its defense capacity. The resulting health gains (416M lives saved globally, proportional by population) far exceed any marginal security value of that 1%.
International Development Priorities
Development agencies face a fundamental problem: the most cost-effective interventions (bed nets at $89/DALY, vaccines) can only scale linearly. Doubling impact requires doubling spending.
Key insight: This intervention scales exponentially through systemic change. It doesn’t compete with existing development programs; it accelerates cure discovery for all diseases affecting developing nations.
Practical application: - Current approach: USAID spends billions on malaria bed nets (excellent intervention, $89/DALY) - Proposed addition: Support 1% treaty adoption, which delivers $0.126/DALY (707× better) while also funding research to cure malaria entirely - Result: Keep funding bed nets (they work!) AND accelerate development of malaria vaccines and treatments through massively expanded trial capacity
The Gates Foundation, USAID, and WHO should advocate for treaty adoption as their highest-leverage intervention: it multiplies the effectiveness of everything else they fund.
Defense Budget Allocation
Military planners optimize for national security. This analysis demonstrates that 1% of military spending provides near-zero marginal security value while generating enormous economic returns when redirected.
Key insight: The economic multiplier for military spending is 0.6 Mercatus (you get $0.50-$1.00 back per dollar spent). The economic multiplier for healthcare investment is 4.3 PMC (2022) (you get $2-$3 back per dollar spent).
Strategic perspective: A nation’s long-term security depends more on economic strength and healthy populations than on marginal weapons systems. Redirecting 1% from the $2.72T global military budget doesn’t compromise defense (99% remains) but generates $155B in annual economic benefits.
Precedent: The U.S. spends more on defense than the next 10 countries combined. A 1% reduction would still leave U.S. defense spending higher than any potential adversary while funding 22.8× more medical research globally.
Global Health Funding Mechanisms
Current global health funding relies on unpredictable philanthropic donations and limited government aid budgets. Total official development assistance for health: ~$40B/year. This intervention creates a $27.2B/year permanent funding stream.
Key insight: This is not charity; it’s profitable. Investors can buy VICTORY Incentive Alignment Bonds paying 272% annual returns backed by the peace dividend, making health funding financially attractive rather than dependent on altruism.
Mechanism design: The 1% Treaty Fund uses an 80/10/10 split: - 80% ($21.7B) → pragmatic trials - 10% ($2.72B) → bond investor returns - 10% ($2.72B) → political incentive alignment
This creates a self-sustaining funding mechanism where: 1. Investors profit from peace dividend returns 2. Politicians profit from voter support and campaign funding 3. Pharma companies profit from massively reduced R&D costs 4. Patients benefit from 8.2-year faster access to cures 5. Governments benefit from healthier, more productive populations
Contrast with current system: WHO’s annual budget (~$6B) depends on voluntary contributions that can be cut at any time. The 1% Treaty creates a $27.2B/year legally-binding funding stream that grows automatically with military budgets.
Implementation Pathway
Policy adoption requires coordination across three levels:
- Municipal/State level: Pilot implementations (e.g., California or Texas adopts 1% National Guard budget reduction, redirects to state-level pragmatic trials)
- National level: Treaty advocacy through referendum campaigns ($300M) and lobbying ($650M)
- International level: UN General Assembly vote on binding treaty requiring 1% redirect from all signatory nations
Critical insight: This doesn’t require global consensus to start. Individual nations can adopt unilaterally and reap 451:1 ROI immediately through domestic trial expansion. International coordination amplifies benefits but isn’t a prerequisite.
Bottom Line for Policymakers
This intervention is cost-dominant (saves money while improving outcomes), making it one of the rarest findings in health economics. It doesn’t require: - New taxes - Reduced health spending - Cuts to popular programs - Technological breakthroughs
It requires only a 1% reallocation from the least cost-effective government spending (military) to the most cost-effective health intervention (pragmatic trials at $500/patient).
The political challenge isn’t economic: the ROI speaks for itself. The challenge is overcoming entrenched interests in military-industrial spending. The solution: Incentive Alignment Bonds that make supporting the treaty more profitable for politicians than opposing it.
Treaty Adoption: Political Will and Diplomatic Strategy
International treaty adoption is fundamentally a political and diplomatic process, not a technical implementation timeline. The 1% Treaty’s viability depends on simultaneous multilateral commitment: no nation reduces military spending unilaterally, creating security vulnerabilities or free-rider problems. All signatories reduce together.
Why Simultaneous Commitment Works
Unilateral military reduction is politically infeasible: - Creates perceived security vulnerability - “Free rider” problem: non-participants benefit from reduced global conflict risk without contributing - Domestic opposition from defense industries
Simultaneous binding commitment solves this: All signatories reduce 1% together, maintaining relative military balance while collectively redirecting $27.2B/year to health research that benefits all participants.
Historical Treaty Precedents
Successful international treaties achieved rapid adoption through diplomatic coalition-building, not phased pilots:
- Ottawa Landmine Ban Treaty (1997): Diplomatic push → international negotiation → 122 nations signed in 2 years
- Paris Climate Agreement (2015): Built on existing framework, achieved 195 signatories through coordinated diplomatic effort
- Chemical Weapons Convention (1993): International negotiation process, 193 state parties
Common pattern: Political will + coalition of willing nations + diplomatic negotiation → treaty adoption
The 1% Treaty follows this model, with the advantage that it offers immediate economic returns (451:1 ROI minimum) rather than requiring sacrifice.
Demonstrating Feasibility
While the treaty itself requires simultaneous adoption, individual nations or sub-national jurisdictions could demonstrate pragmatic trial feasibility: - Oxford RECOVERY trial already proved $500/patient cost (82× reduction) is achievable - Nations could pilot expanded pragmatic trial systems domestically to demonstrate health and economic benefits - This builds empirical evidence for treaty negotiations but is not a prerequisite
Adoption Pathway
Treaty adoption depends on: 1. Political coalition: Build support among health ministries, fiscal conservatives seeking budget efficiency, and populations demanding better healthcare 2. Economic case: 451:1 ROI makes this profitable, not charitable 3. VICTORY Incentive Alignment Bonds: Fund $1B advocacy campaign, align investor and political incentives 4. Diplomatic negotiation: UN General Assembly or coalition of willing nations
Timeline: Highly variable depending on political momentum. Successful precedents range from 18 months (rapid consensus) to 5+ years (extended negotiation). The self-funding nature and aligned incentives favor faster adoption than typical treaties requiring sacrifice.
Conclusion
Redirecting 1% of global military spending to pragmatic clinical trials generates 451:1 to 1.19M:1 ROI, depending on what you count.
The Numbers:
- Zero new spending: Money redirected from existing military budgets
- Dominant intervention: Saves money while saving lives (rare in health economics)
- Conservative case: 451:1 ROI counting only R&D efficiency
\[ ROI_{RD} = \frac{\$249.3B}{\$0.54B} \approx 463 \]
- Complete case: 1.19M:1 ROI including all eight benefit streams ($155B annually)
- Lives saved: 416M while generating net profit
- Political feasibility: Everyone profits (nobody needs to be convinced, just paid)
Comparison: Exceeds smallpox eradication and childhood vaccinations (history’s previous best public health achievements) while requiring zero charitable donations. (Detailed comparisons)
Timeline: 36 months from global referendum to full deployment. (Complete roadmap)
The Evidence: Conservative assumptions, validated by Oxford RECOVERY trial, tested via sensitivity analysis. Uses standard health economics (NPV, QALYs, ICER) for direct comparison with existing interventions.
The Reality: This works because every step is economically rational for everyone involved. Nobody needs to evolve morally. They just need to count.
There’s a quadrillion-dollar bill lying on the sidewalk. The math shows it’s real. The only question is whether humanity picks it up.
Notes
For complete bibliography, data sources, and citations, see:
- References - Comprehensive bibliography of all cited sources
- Parameters and Calculations Reference - Complete documentation of all 422 parameters with LaTeX equations, confidence indicators, and source attribution
- Data Sources - 130 external parameters from peer-reviewed sources
References
AARP. (2023). Unpaid caregiver hours and economic value. AARP 2023. https://www.aarp.org/caregiving/financial-legal/info-2023/unpaid-caregivers-provide-billions-in-care.html
ACLED. (2024). Active combat deaths annually. ACLED: Global Conflict Surged 2024. https://acleddata.com/2024/12/12/data-shows-global-conflict-surged-in-2024-the-washington-post/
al., B. et. (2023). NIH spending on clinical trials: 3.3%. Bentley Et Al. https://www.fiercebiotech.com/biotech/nih-spending-clinical-trials-reached-81b-over-decade
Bank, W. (a). Swiss military budget as percentage of GDP. World Bank: Military Expenditure. https://data.worldbank.org/indicator/MS.MIL.XPND.GD.ZS?locations=CH
Bank, W. (b). Switzerland vs. US GDP per capita comparison. World Bank: Switzerland GDP Per Capita. https://data.worldbank.org/indicator/NY.GDP.PCAP.CD?locations=CH
Bank, W. (c). World bank trade disruption cost from conflict. World Bank. https://www.worldbank.org/en/topic/trade/publication/trading-away-from-conflict
Bank, W. (2022). Infrastructure investment economic multiplier (1.6). World Bank: Infrastructure Investment as Stimulus. https://blogs.worldbank.org/en/ppps/effectiveness-infrastructure-investment-fiscal-stimulus-what-weve-learned
Based on WHO Global Health Estimates showing 55 million annual deaths / 365 days = 150, 000. per day |. W. (2024). 150,000 deaths per day from all causes. Based on WHO Global Health Estimates Showing 55 Million Annual Deaths / 365 Days = 150. https://www.who.int/news-room/fact-sheets/detail/the-top-10-causes-of-death
(BIO), B. I. O. (2021). BIO clinical development success rates 2011-2020. Biotechnology Innovation Organization (BIO). https://go.bio.org/rs/490-EHZ-999/images/ClinicalDevelopmentSuccessRates2011_2020.pdf
BLS. (2024). Average US hourly wage. BLS. https://www.bls.gov/news.release/pdf/ocwage.pdf
budgets:, S. component country. Global government medical research spending ($67.5B, 2023–2024). See Component Country Budgets: NIH Budget. #nih-budget-fy2025
Bureau, U. C. Historical world population estimates. US Census Bureau. https://www.census.gov/data/tables/time-series/demo/international-programs/historical-est-worldpop.html
Bureau, U. C. (2024). Number of registered or eligible voters in the u.s. US Census Bureau. https://www.census.gov/newsroom/press-releases/2025/2024-presidential-election-voting-registration-tables.html
CAN, A. Clinical trial patient participation rate. ACS CAN: Barriers to Clinical Trial Enrollment. https://www.fightcancer.org/policy-resources/barriers-patient-enrollment-therapeutic-clinical-trials-cancer
Cardiology, I. J. of. (2050). Annual global economic burden of heart disease. Int’l Journal of Cardiology: Global Heart Failure Burden02238-9/Abstract). https://www.internationaljournalofcardiology.com/article/S0167-5273(13
Care, D. Annual global economic burden of diabetes. Diabetes Care: Global Economic Burden. https://diabetesjournals.org/care/article/41/5/963/36522/Global-Economic-Burden-of-Diabetes-in-Adults
CDC. U.s. Chronic disease healthcare spending. CDC. https://www.cdc.gov/chronic-disease/data-research/facts-stats/index.html
CDC. (2017). Childhood vaccination (US) ROI. CDC. https://www.cdc.gov/mmwr/preview/mmwrhtml/mm6316a4.htm
C&EN. (2025). Annual number of new drugs approved globally: 50. C&EN. https://cen.acs.org/pharmaceuticals/50-new-drugs-received-FDA/103/i2
CGDev. (2024). UNHCR average refugee support cost. CGDev. https://www.cgdev.org/blog/costs-hosting-refugees-oecd-countries-and-why-uk-outlier
CNBC. (2025). Warren buffett’s career average investment return. CNBC. https://www.cnbc.com/2025/05/05/warren-buffetts-return-tally-after-60-years-5502284percent.html
CSDD, T. Cost of drug development.
CSIS. Smallpox eradication ROI. CSIS. https://www.csis.org/analysis/smallpox-eradication-model-global-cooperation
Data, O. W. in. (2024). Terror attack deaths (8,300 annually). Our World in Data: Terrorism. https://ourworldindata.org/terrorism
Deloitte. (2025). Pharmaceutical r&d return on investment (ROI). Deloitte: Measuring Pharmaceutical Innovation 2025. https://www.deloitte.com/ch/en/Industries/life-sciences-health-care/research/measuring-return-from-pharmaceutical-innovation.html
Discovery, N. R. D. (2016). Drug trial success rate from phase i to approval. Nature Reviews Drug Discovery: Clinical Success Rates. https://www.nature.com/articles/nrd.2016.136
DOT. (2024). DOT value of statistical life ($13.6M). DOT: VSL Guidance 2024. https://www.transportation.gov/office-policy/transportation-policy/revised-departmental-guidance-on-valuation-of-a-statistical-life-in-economic-analysis
Drugs.com. FDA drug approval timeline. Drugs.com: FDA Drug Approval Process. https://www.drugs.com/fda-approval-process.html
EPI. Education investment economic multiplier (2.1). EPI: Public Investments Outside Core Infrastructure. https://www.epi.org/publication/bp348-public-investments-outside-core-infrastructure/
EPI. (2024). CEO compensation. EPI. https://www.epi.org/blog/ceo-pay-increased-in-2024-and-is-now-281-times-that-of-the-typical-worker-new-epi-landing-page-has-all-the-details/
estimates, I. Clinical trial abandonment.
FDA. (a). FDA GRAS list count ( 570-700). FDA. https://www.fda.gov/food/generally-recognized-safe-gras/gras-notice-inventory
FDA. (b). FDA-approved prescription drug products (20,000+). FDA. https://www.fda.gov/media/143704/download
GAO. Annual cost of u.s. Sugar subsidies. GAO: Sugar Program. https://www.gao.gov/products/gao-24-106144
GAO. (2025). 95% of diseases have no effective treatment. GAO. https://www.gao.gov/products/gao-25-106774
GiveWell. (a). Cost per DALY for deworming programs. https://www.givewell.org/international/technical/programs/deworming/cost-effectiveness
GiveWell. (b). GiveWell cost per life saved for top charities (2024). GiveWell: Top Charities. https://www.givewell.org/charities/top-charities
Health, V. in. Average lifetime revenue per successful drug. Value in Health: Sales Revenues for New Therapeutic Agents02754-2/Fulltext). https://www.valueinhealthjournal.com/article/S1098-3015(24
ICER. (2024). Value per QALY (standard economic value). ICER. https://icer.org/wp-content/uploads/2024/02/Reference-Case-4.3.25.pdf
ICRC. (1997). International campaign to ban landmines (ICBL) - ottawa treaty (1997). ICRC. https://www.icrc.org/en/doc/resources/documents/article/other/57jpjn.htm
IHME Global Burden of Disease (2.55B DALYs), C. from, & GDP per capita valuation, global. $109 trillion annual global disease burden.
Institute, C. Chance of dying from terrorism statistic. Cato Institute: Terrorism and Immigration Risk Analysis. https://www.cato.org/policy-analysis/terrorism-immigration-risk-analysis
Institute, I. B. (2024). Chronic illness workforce productivity loss. Integrated Benefits Institute 2024. https://www.ibiweb.org/resources/chronic-conditions-in-the-us-workforce-prevalence-trends-and-productivity-impacts
Institute, M. RECOVERY trial 82× cost reduction. Manhattan Institute: Slow Costly Trials. https://manhattan.institute/article/slow-costly-clinical-trials-drag-down-biomedical-breakthroughs
literature, E. psychology. Average reading speed.
Medicine, J. I. Phase 3 cost per patient. JAMA Internal Medicine. https://jamanetwork.com/journals/jamainternalmedicine/fullarticle/2702287
Medicine, N. (2024). Drug repurposing rate ( 30%). Nature Medicine. https://www.nature.com/articles/s41591-024-03233-x
Mercatus. Military spending economic multiplier (0.6). Mercatus: Defense Spending and Economy. https://www.mercatus.org/research/research-papers/defense-spending-and-economy
MMWR, C. (1994). Childhood vaccination economic benefits. CDC MMWR. https://www.cdc.gov/mmwr/volumes/73/wr/mm7331a2.htm
NCBI, F. S. via. Trial costs, FDA study. FDA Study via NCBI. https://www.ncbi.nlm.nih.gov/pmc/articles/PMC6248200/
News, U. (2014). Clean water & sanitation (LMICs) ROI. UN News. https://news.un.org/en/story/2014/11/484032
NHGRI. (2003). Human genome project and CRISPR discovery. NHGRI. https://www.genome.gov/11006929/2003-release-international-consortium-completes-hgp
NIH. (2015). Antidepressant clinical trial exclusion rates. Zimmerman Et Al. https://pubmed.ncbi.nlm.nih.gov/26276679/
Numbers, T. by. Post-1962 drop in new drug approvals. Think by Numbers: How Many Lives Does FDA Save? https://thinkbynumbers.org/health/how-many-net-lives-does-the-fda-save/
Numbers, T. by. (1962). Pre-1962 drug development costs and timeline. Think by Numbers: How Many Lives Does FDA Save? https://thinkbynumbers.org/health/how-many-net-lives-does-the-fda-save/
Numbers, T. by. (1966). Pre-1962 physician-led clinical trials. Think by Numbers: How Many Lives Does FDA Save? https://thinkbynumbers.org/health/how-many-net-lives-does-the-fda-save/
Numbers, T. by. (2021). Lost human capital due to war ($270B annually). <https://thinkbynumbers.org/military/war/the-economic-case-for-peace-a-comprehensive-financial-analysis/>
Oncology, J. (2020). Annual global economic burden of cancer. JAMA Oncology: Global Cost 2020-2050. https://jamanetwork.com/journals/jamaoncology/fullarticle/2801798
ONE, P. (2010). Cost per DALY for vitamin a supplementation. PLOS ONE: Cost-Effectiveness of "Golden Mustard" for Treating Vitamin A Deficiency in India (2010). https://journals.plos.org/plosone/article?id=10.1371/journal.pone.0012046
One, P. (2019). Health and quality of life of thalidomide survivors as they age. PLOS One. https://journals.plos.org/plosone/article?id=10.1371/journal.pone.0210222
OpenSecrets. Lobbyist statistics for washington d.c. OpenSecrets: Lobbying in US. https://en.wikipedia.org/wiki/Lobbying_in_the_United_States
OpenSecrets. (2024). Lobbying spend (defense). OpenSecrets. https://www.opensecrets.org/federal-lobbying/industries/summary?cycle=2024\&id=D
Oren Cass, M. I. (2023). RECOVERY trial cost per patient. Oren Cass. https://manhattan.institute/article/slow-costly-clinical-trials-drag-down-biomedical-breakthroughs
Organization, W. H. (2022). Mental health global burden. World Health Organization. https://www.who.int/news/item/28-09-2001-the-world-health-report-2001-mental-disorders-affect-one-in-four-people
Organization, W. H. (2024). WHO global health estimates 2024. World Health Organization. https://www.who.int/data/gho/data/themes/mortality-and-global-health-estimates
PMC. (2012). Contribution of smoking reduction to life expectancy gains. PMC: Benefits Smoking Cessation Longevity. https://www.ncbi.nlm.nih.gov/pmc/articles/PMC1447499/
PMC. (2022). Healthcare investment economic multiplier (1.8). PMC: California Universal Health Care. https://pmc.ncbi.nlm.nih.gov/articles/PMC5954824/
PMC. (2023). Only 12% of human interactome targeted. PMC. https://pmc.ncbi.nlm.nih.gov/articles/PMC10749231/
PubMed. Psychological impact of war cost ($100B annually). PubMed: Economic Burden of PTSD. https://pubmed.ncbi.nlm.nih.gov/35485933/
Report, I. Global trial capacity. IQVIA Report: Clinical Trial Subjects Number Drops Due to Decline in COVID-19 Enrollment. https://gmdpacademy.org/news/iqvia-report-clinical-trial-subjects-number-drops-due-to-decline-in-covid-19-enrollment/
Research, P. Clinical trial cost per patient (traditional phase III). ProRelix Research. https://prorelixresearch.com/phase-by-phase-clinical-trial-costs-what-every-sponsor-needs-to-know/
Research, & Markets. (2024). Global clinical trials market 2024. Research and Markets. https://www.globenewswire.com/news-release/2024/04/19/2866012/0/en/Global-Clinical-Trials-Market-Research-Report-2024-An-83-16-Billion-Market-by-2030-AI-Machine-Learning-and-Blockchain-will-Transform-the-Clinical-Trials-Landscape.html
School, H. K. (2020). 3.5% participation tipping point. Harvard Kennedy School. https://www.hks.harvard.edu/centers/carr/publications/35-rule-how-small-minority-can-change-world
ScienceDaily. (2015). Global prevalence of chronic disease. ScienceDaily: GBD 2015 Study. https://www.sciencedaily.com/releases/2015/06/150608081753.htm
ScienceDaily. (2020). Medical research lives saved annually (4.2 million). ScienceDaily: Physical Activity Prevents 4M Deaths. https://www.sciencedaily.com/releases/2020/06/200617194510.htm
SIPRI. (2016). 36:1 disparity ratio of spending on weapons over cures. SIPRI: Military Spending. https://www.sipri.org/commentary/blog/2016/opportunity-cost-world-military-spending
SIPRI. (2025). Global military spending ($2.72T, 2024). SIPRI. https://www.sipri.org/publications/2025/sipri-fact-sheets/trends-world-military-expenditure-2024
SofproMed. Phase 3 cost per trial range. SofproMed. https://www.sofpromed.com/how-much-does-a-clinical-trial-cost
Statista. (2024). US military budget as percentage of GDP. Statista. https://www.statista.com/statistics/262742/countries-with-the-highest-military-spending/
Suisse/UBS, C. (2023). Credit suisse global wealth report 2023. Credit Suisse/UBS. https://www.ubs.com/global/en/family-office-uhnw/reports/global-wealth-report-2023.html
Trials. Patient willingness to participate in clinical trials. Trials: Patients’ Willingness Survey. https://trialsjournal.biomedcentral.com/articles/10.1186/s13063-015-1105-3
Trials, A. C. Applied Clinical Trials. https://www.appliedclinicaltrialsonline.com/view/sizing-clinical-research-market
UCDP. State violence deaths annually. UCDP: Uppsala Conflict Data Program. https://ucdp.uu.se/
UN. (2022). Global population reaches 8 billion. UN: World Population 8 Billion Nov 15 2022. https://www.un.org/en/desa/world-population-reach-8-billion-15-november-2022
VA. (2026). Veteran healthcare cost projections. VA. https://department.va.gov/wp-content/uploads/2025/06/2026-Budget-in-Brief.pdf
Vaccines, M. (2024). Measles vaccination ROI. MDPI Vaccines. https://www.mdpi.com/2076-393X/12/11/1210
via, D. analysis. ClinicalTrials.gov cumulative enrollment data (2025). Direct Analysis via ClinicalTrials.gov API V2. https://clinicaltrials.gov/data-api/api
War, B. W. C. of. Environmental cost of war ($100B annually). Brown Watson Costs of War: Environmental Cost. https://watson.brown.edu/costsofwar/costs/social/environment
WHO. (2019a). Annual global economic burden of alzheimer’s and other dementias. WHO: Dementia Fact Sheet. https://www.who.int/news-room/fact-sheets/detail/dementia
WHO. (2019b). ICD-10 code count ( 14,000). WHO. https://icd.who.int/browse10/2019/en
WHO. (2019c). Polio vaccination ROI. WHO. https://www.who.int/news-room/feature-stories/detail/sustaining-polio-investments-offers-a-high-return
Wikipedia. (a). Longevity escape velocity (LEV) - maximum human life extension potential. Wikipedia: Longevity Escape Velocity. https://en.wikipedia.org/wiki/Longevity_escape_velocity
Wikipedia. (b). Thalidomide scandal: Worldwide cases and mortality. Wikipedia. https://en.wikipedia.org/wiki/Thalidomide_scandal
Wikipedia. (2020). US military spending reduction after WWII. Wikipedia. https://en.wikipedia.org/wiki/Demobilization_of_United_States_Armed_Forces_after_World_War_II
Reuse
Copyright
© 2025 Mike P. Sinn